
Every TA leader I talk to in 2026 can name the five stages of their recruitment funnel. Most can recite the conversion rates between each stage off the top of their head. Far fewer can tell you, with any specificity, why a conversion moved last month. That gap, between tracking a funnel and explaining it, is the most expensive thing in recruiting right now. It is also the gap that lets the same leaks keep happening, quarter after quarter, under different names.
The audit on the original version of this article asked us to do one specific thing: stop describing the funnel in the abstract and start describing the data layer underneath it. We agree. The five stages are well known. The five places they leak are well known. The part almost no team has wired correctly is the structured interview signal that explains what changed at each stage, in time to do something about it. That is the layer this guide is about.
What you will get below: how the recruitment funnel actually measures (and the thing it hides), the five stage-by-stage leak patterns we see most often, how to map your funnel without losing two weeks to ATS exports, a side-by-side comparison of manual, generic AI, and Metaview at each stage, the feedback loop that closes the gap between ‘conversion dropped’ and ‘this is why,’ and a 30-60-90 instrumentation plan a TA leader can hand to a hiring ops partner on Monday.
What the recruitment funnel actually measures (and what it hides)
Define the recruitment funnel in functional terms and the picture is the same on every team. It is a structured pathway candidates move through, from application or outreach to hire, with a measurable conversion rate at each handoff. Sourcing into screening, screening into interviewing, interviewing into offer, offer into hire. Every applicant tracking system draws it the same way. Every TA leader has the chart somewhere on a dashboard.
What the chart measures is movement. A candidate left stage 2, a candidate entered stage 3, and the ratio of those two numbers is your conversion rate at the screen step. What the chart does not measure is anything about the substance of that movement. Why did this candidate move and that one not? Who asked the questions? Were they the right questions for the role? Did the panel hear the same answers? Was the rejection driven by the rubric or by the interviewer’s memory of how the call felt?
That is the gap the auditor on the original draft flagged. The earlier version described the funnel in stages and offered generic AI advice for each. The actual question a TA leader has is more specific: when conversion at stage 3 drops six points month over month, which two interviewers, on which competency, gave us the new pattern? You cannot answer that with the funnel chart alone. You answer it with the interview signal underneath.
The case for instrumenting the layer below the funnel is now data-backed, not hypothetical. According to Metaview’s 2026 AI & Hiring Alignment Report - surveying 505 recruiting leaders and hiring managers across North America and EMEA, 85% of companies exceeding their hiring goals use AI in hiring, and the gap between AI-core teams and no-AI teams shows up most clearly at the start of the funnel. Only 49% of searches at non-AI teams start with high alignment on requirements; that delta cascades into every stage that follows.
If there’s an underlying theme to the work that I’m doing here at ZoomInfo, it’s how do you strengthen the quality of the data that you bring to the table when you’re looking to hire.”
The 5 stages and the 5 places they leak
Funnels leak the same way across most teams. The labels change, the numbers vary, but the patterns are remarkably consistent. Here is the stage-by-stage map of what we see most often, paired with the data signal that makes each leak visible before it shows up as a missed quarter.
Stage 1: Sourcing
The leak: top-of-funnel volume is fine, but the share of qualified candidates is below expectations. The cause is rarely sourcing tactics. It is misalignment between what the job ad says, what the recruiter is screening for, and what the hiring manager will actually accept on a debrief. The data signal that exposes it: structured comparison of intake-call requirements against screen-stage rejection reasons. If rejections cluster around criteria that were not in the intake notes, the funnel is leaking at the spec, not the source.
Stage 2: Screening
The leak: screen-to-interview conversion looks healthy until you check it by recruiter. One recruiter is converting at 12%, another at 38%. The chart averages to 24%, and the team-level funnel report does not catch the variance. The data signal that exposes it: screen-call notes structured against the same rubric across the team. Without rubric capture, you cannot tell whether the high-converting recruiter is finding hidden gems or shipping marginal candidates forward.
Stage 3: Interviewing
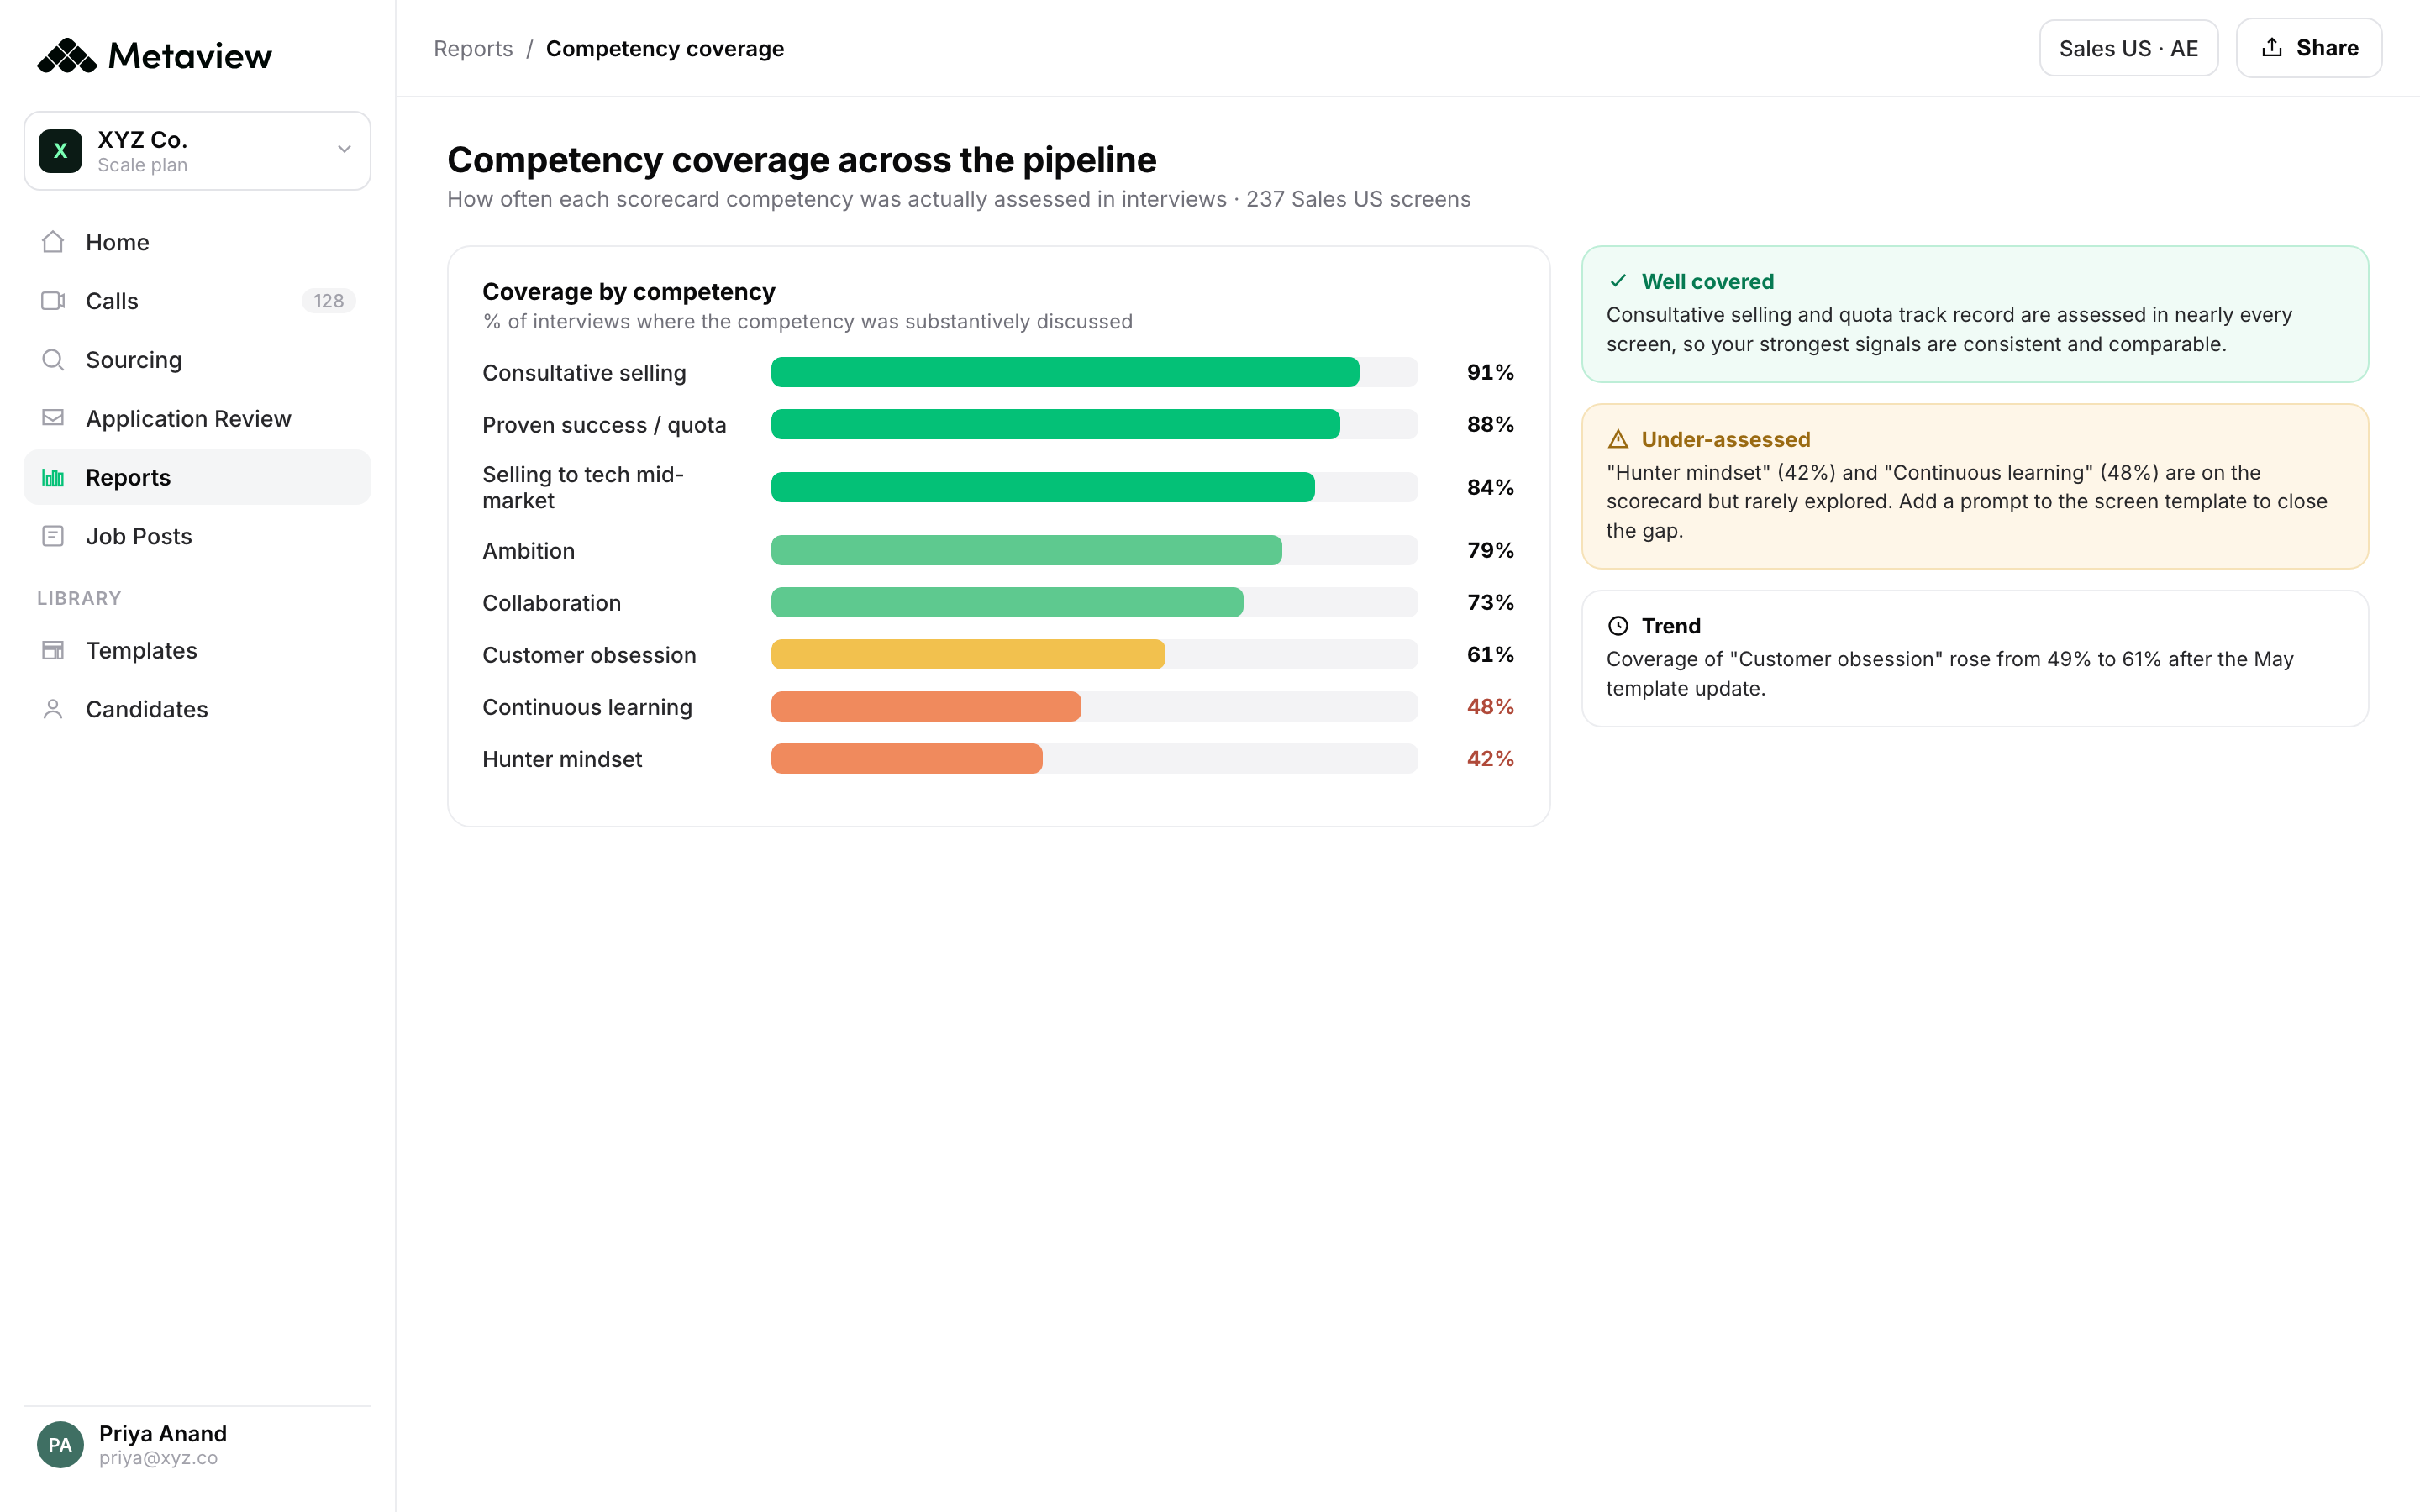
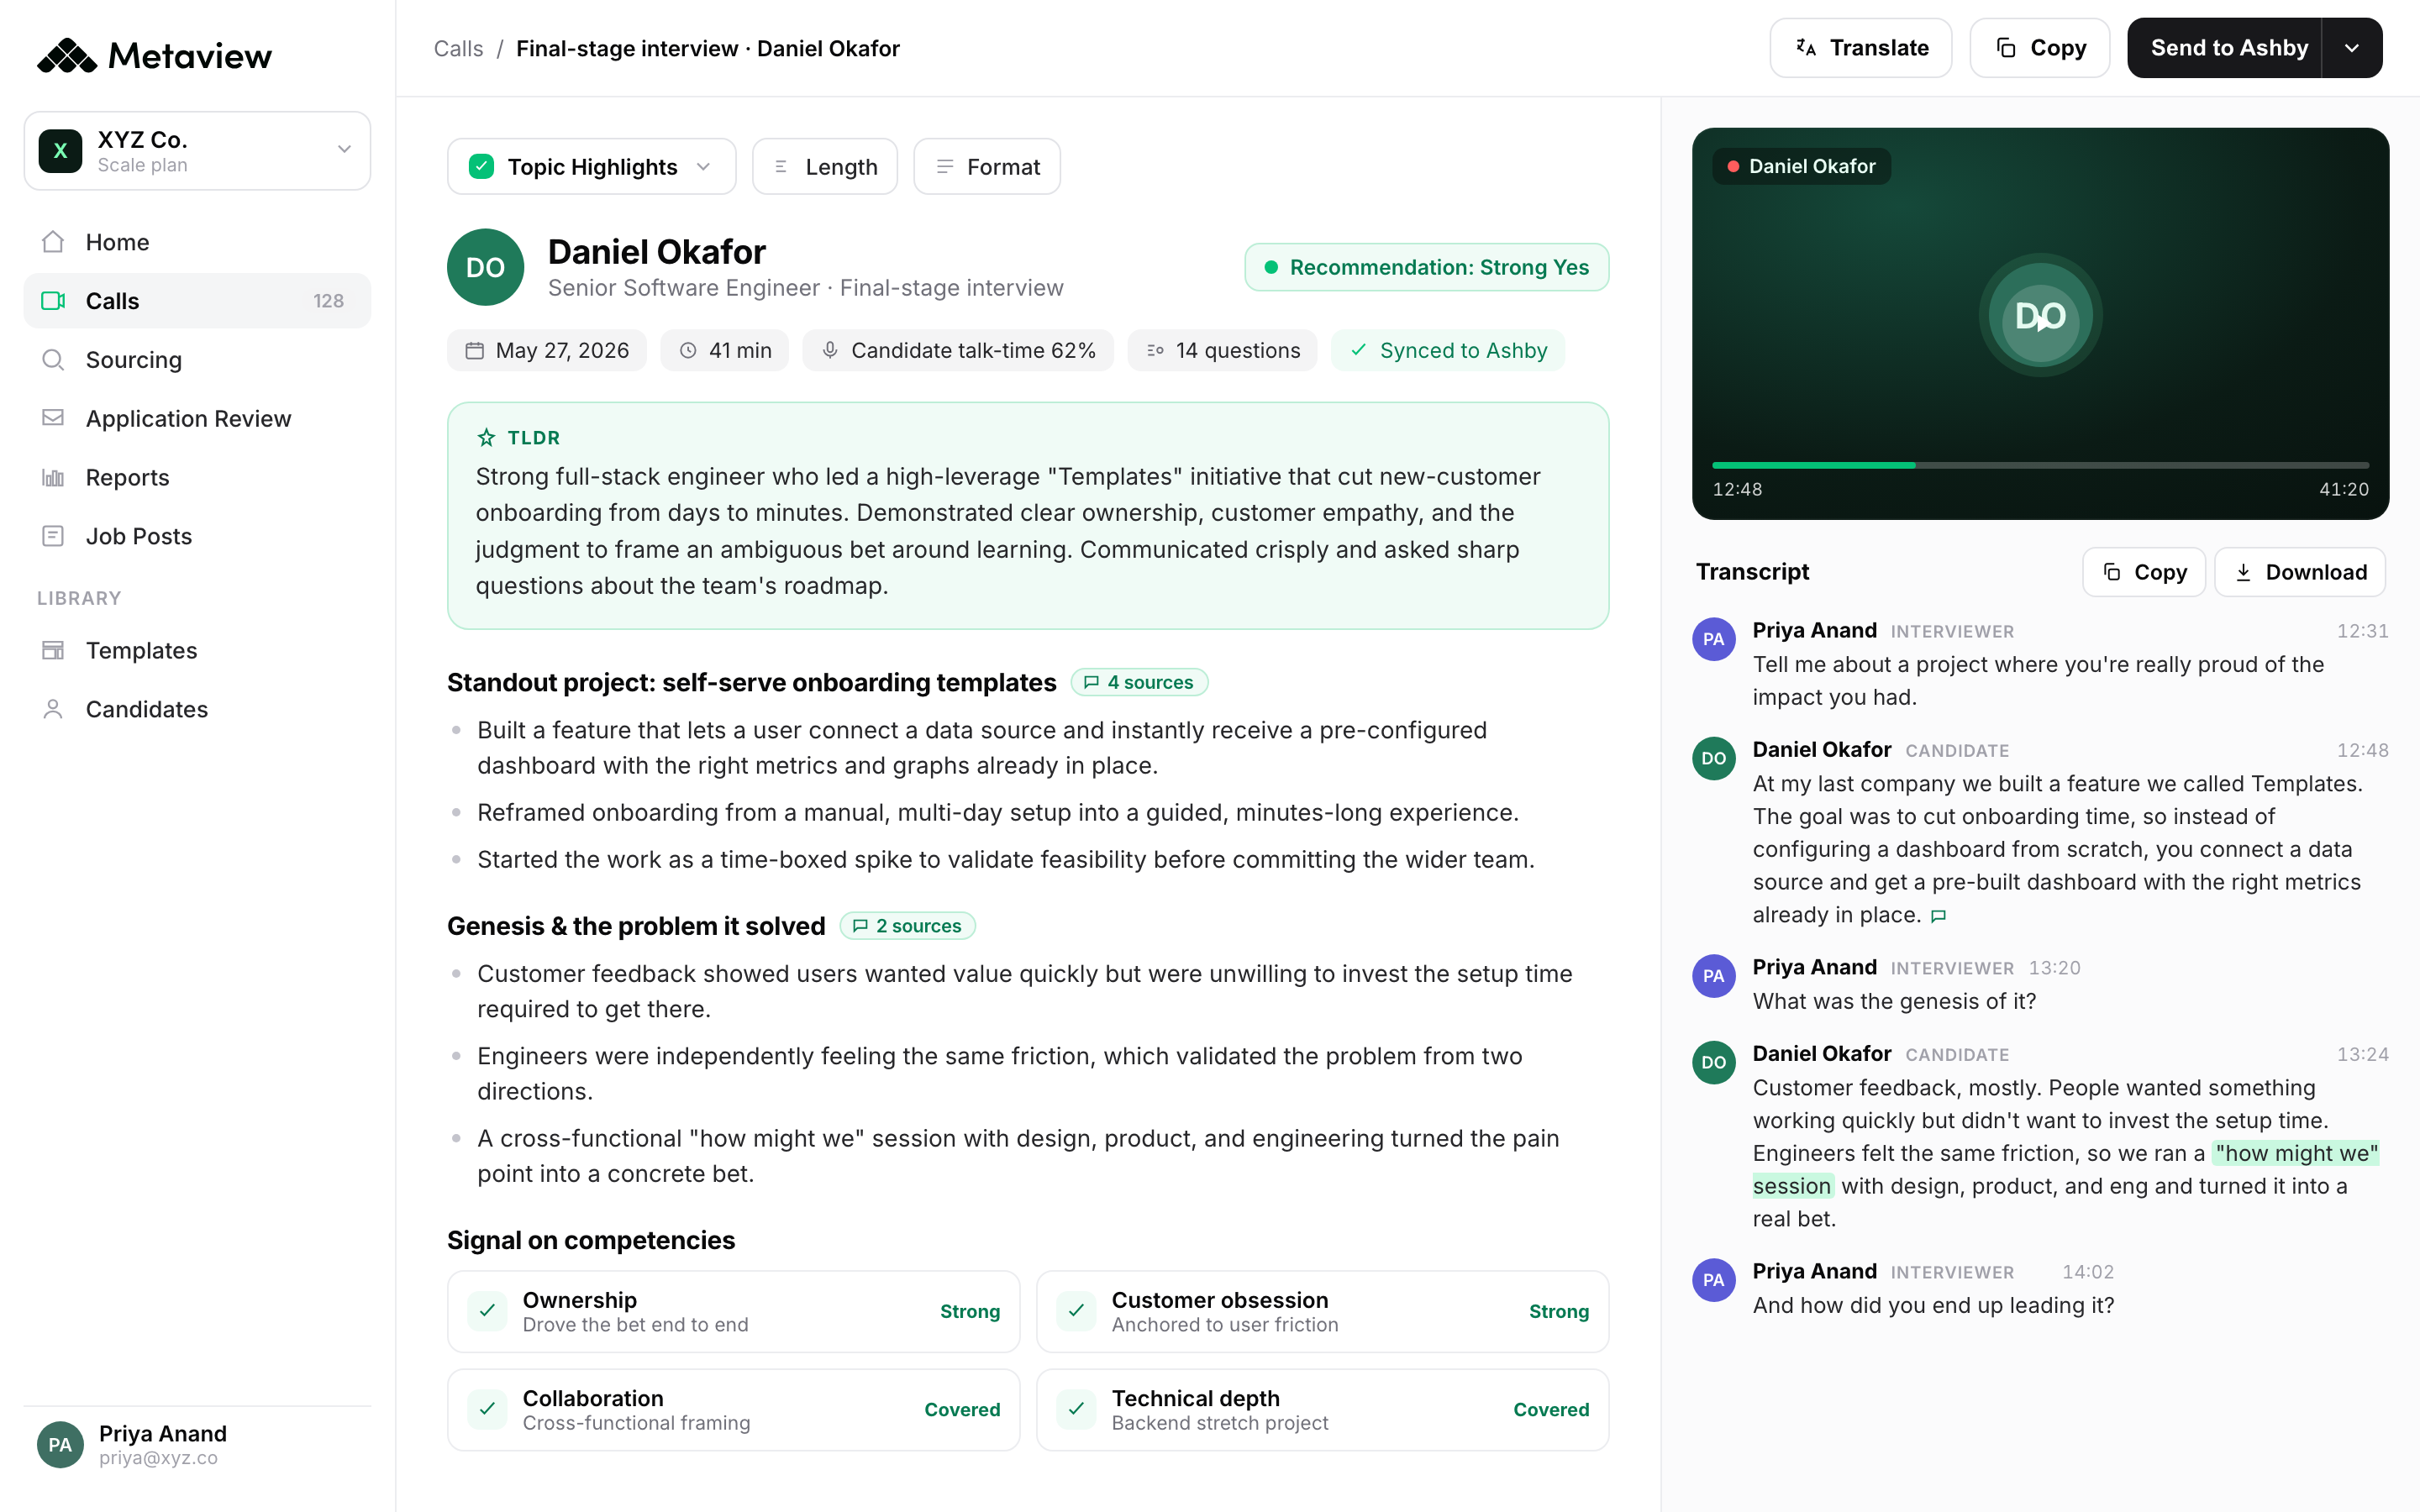
The leak: interview-to-offer conversion swings stage over stage and quarter over quarter, and nobody can explain it. The most common pattern is that panels are running different versions of the same interview. One interviewer asks for live code, another asks for past experience, the third asks for behavioral examples. They are all assessing ‘the engineering bar,’ but they are not pulling the same signal. The data signal that exposes it: interviewer-level reports against the question rubric. When one interviewer is asking three of the seven competencies and another is asking five, the conversion drift becomes a coverage problem, not a quality problem.
Stage 4: Offer
The leak: offers go out, candidates take longer than expected to respond, and acceptance rates drop without an obvious cause. The pattern is almost always debrief drift. The hiring manager forms the offer recommendation from memory of the panel, not from the recorded signal of who said what. By the time the offer letter goes out, the framing has subtly shifted, and the candidate hears a pitch that does not match the conversation they had. The data signal: post-interview multi-source summaries that the hiring manager can pull from at offer time, instead of recall.
Stage 5: Hire-to-Quality
The leak everyone admits has no good data: do the people we hired actually do the job we hired them for. The connection between funnel performance and hire quality is usually broken, because the panel signal that produced the offer is unrecoverable six months later. The data signal: the same structured interview record, queryable when a hiring manager flags a performance pattern. The team that can ask ‘show me the panel notes for everyone we hired into Sales Engineer in 2025 who did not survive ramp’ has closed the loop. Most teams cannot.
How to map your funnel without losing two weeks to ATS exports
Most funnel-mapping exercises drown in ATS export work. The data lives in three different objects (candidates, applications, interview events), the joins are inconsistent, and the conversion math has to be redone every time someone renames a stage. By the time the spreadsheet is clean enough to read, the question the TA leader was trying to answer has aged out.
Here is the version of the mapping exercise that does not lose two weeks. Define the five stages first, the way your team actually uses them, not the way the ATS labels them. Pull conversion rates at each handoff for the last 90 days. For each stage, identify the single most important signal capture point: intake notes for stage 1, structured screen notes for stage 2, panel transcripts for stage 3, panel debrief notes for stage 4, the same panel record retrieved at 90 days for stage 5. That is the audit map.
The shortcut on this exercise is to skip the months of spreadsheet engineering and start at the signal capture layer instead. If every interview is being captured at the stage it happens, the funnel report builds itself out of the interview data, instead of requiring a quarterly archaeology project. That is the part of the workflow most teams have not turned on yet, and it is also why the original draft of this article called the AI section ‘automate’ instead of ‘instrument.’ They are not the same thing.
Manual, Generic AI, and Metaview at each stage
The auditor on the original draft specifically asked for a side-by-side comparison table, and they were right. The five-stage breakdown reads as three different workflows depending on whether you are running it manually, with a stack of generic AI tools, or with Metaview as the structured signal layer. Here is the comparison.
| Stage | Manual | Generic AI | Metaview |
|---|---|---|---|
| Sourcing | Recruiter eyeballs inbound against a static job spec; intake misalignment shows up later. | A separate AI resume screener ranks against the job description; no link to intake or rubric. | Application Review ranks inbound against the ideal-candidate profile, which updates from every recruiter and hiring manager decision. |
| Screening | Free-text screen notes; recruiter-to-recruiter conversion swings 12-38% without anyone noticing. | A separate AI notetaker writes a transcript; nothing connects it to the rubric or the next interviewer. | Structured screen notes against the role rubric; recruiter-level conversion is visible by competency. |
| Interviewing | Panels run different versions of the same interview; competency coverage is uneven and invisible. | Each interviewer’s notetaker produces a one-off transcript; panel-level signal does not aggregate. | Panel-level reports against the question rubric show coverage, drift, and consistency by interviewer. |
| Offer | Hiring manager pitches the role from memory of the panel; framing drifts from the panel conversation. | A summarizer condenses one transcript; multi-source debrief still relies on recall. | Multi-source summaries pull cross-panel signal in one place, so the offer matches the conversation the candidate had. |
| Hire-to-Quality | Panel signal that produced the offer is unrecoverable six months later; root-cause analysis is anecdotal. | Transcripts may exist but aren’t queryable by role, competency, or interviewer. | The same structured interview record is queryable at 90 days; hiring leaders can audit decisions by role and outcome. |
The pattern under the table is the boring one. Manual is fine when volume is low and the team has senior interviewers everywhere. Generic AI helps at specific moments, but it does not connect them. The Metaview argument is the same signal at every stage, every interviewer, queryable later. The compounding is in the connection, not in any one cell.
Closing the feedback loop: stage data should drive stage decisions
A funnel report that does not change behavior is a screenshot. The point of the data layer is to close the loop between ‘conversion at stage 3 dropped’ and ‘we ran a coaching conversation with the two interviewers who account for it on Tuesday.’ The feedback loop is what makes the funnel a learning system instead of a periodic disappointment.
Siadhal Magos, our co-founder, made this point cleanly in a recent short video: conversations are becoming the differentiator in recruiting, and the recruiters who can read what is happening inside a conversation in time to act on it will out-recruit the ones who cannot. The funnel sits downstream of those conversations. If you can read them, you can read the funnel.
The loop has three pieces. First, the data captured at stage has to be specific to the question a TA leader will ask later. A conversion percentage on its own does not pass that test. Interviewer-level coverage against a rubric does. Second, the data has to be available before the quarterly review. Weekly is the cadence we see working at Metaview customers, because that is the cadence at which an interviewer can actually change behavior. Third, the action has to be at the interviewer level, not the funnel level. Funnels do not change behavior. Coaching conversations with named interviewers do.
Hiring managers want to see data, not feelings. When you can say ‘75% of candidates in this market expect remote work’ and back it up with real conversation data, it changes the conversation.”
Catawiki’s TA team described this shift cleanly when they wrote about how Metaview Reports changed the way they advise hiring managers. The reframe is small, but it is the whole game: from feelings about the panel to evidence from the conversation. That is what closing the loop sounds like in practice.
Once the loop is closed, a conversion drop at stage 3 stops being a mystery. It becomes a specific question with a specific owner. That is the difference between a funnel that gets reported on and a funnel that gets fixed.
A 30-60-90 instrumentation plan
A TA leader does not need a six-month project to wire the data layer underneath the funnel. The 30-60-90 plan below is the version we see working most often on Metaview customer rollouts, and it is the version I’d hand to a hiring ops partner on a Monday morning to get started.
- Days 1 to 30: turn on live interview capture across every interview at the screen stage and the panel stage. Confirm the rubric for each role is loaded into the capture surface, so the AI Notes feed the right competencies. By day 30, every interview is producing structured data, and the back-loaded transcription project goes away.
- Days 31 to 60: wire Application Review onto inbound for the two highest-volume roles. The ATS gets autofilled scorecards from the panel notes. Pull the first 60-day funnel report off the new data layer and compare it to what the old ATS export was telling you. The differences are the leaks the old report was hiding.
- Days 61 to 90: switch on interviewer-level dashboards. Run the first two coaching conversations using interviewer reports as the agenda, not recall. By day 90, the feedback loop is closed: stage data is driving stage decisions weekly, and the funnel report is being used to fix things, not just to read them.
That sequence is the cheapest insurance you can buy against the five leaks above. Each phase produces a specific artifact, each artifact is the input the next phase needs, and at the end the funnel is something you can read in real time rather than autopsy in a quarterly review.
 Metaview Technologies
- Funnel report runs on ATS stage transitions; conversion percentages move but no one can explain why.
- Screen-call notes are free text in three different formats; recruiter-level variance is invisible inside the team average.
- Panel debriefs run on memory; competency coverage drifts by interviewer with no feedback loop.
- Hire-to-quality questions land in the recruiter’s lap six months late, with no recoverable signal from the panel.
- Funnel report runs on the same structured interview signal the panel actually produced, so the why is one click below the what.
- Screen notes are tagged against the role rubric; recruiter-level conversion is visible by competency, not just by stage.
- Panel reports show coverage and drift by interviewer; weekly coaching conversations run off the data, not recall.
- Hire-to-quality is a one-query lookup: pull the panel signal for everyone hired into the role last year and look for the pattern.
Bring Metaview into your hiring stack.
Live notes, structured scorecards, and ATS sync - set up in under 10 minutes.
Frequently asked
What is the recruitment funnel and why does it matter?
The recruitment funnel is the structured pathway candidates move through from initial application or outreach to hire, usually broken into five stages: sourcing, screening, interviewing, offer, and hire. It matters because it lets a TA leader see where candidates drop off, but only if the data layer underneath each stage is rich enough to explain the drops. Conversion percentages on their own tell you something moved; they do not tell you why.
What are the five most common leak points in a recruitment funnel?
Sourcing yield (intake-spec misalignment), screening signal (recruiter-to-recruiter variance), interview consistency (uneven competency coverage by interviewer), debrief drift (offer framing drifting from the panel conversation), and the hire-to-quality loop (panel signal that produced the offer becoming unrecoverable six months later). Each leak has a specific data signal that, when captured at stage, makes the fix actionable in days instead of quarters.
How is the recruitment funnel different from the candidate journey?
The funnel measures the recruiter-facing process: stages, conversion rates, time-in-stage, sourcing channels. The candidate journey measures the experience from the candidate’s side: how they heard about the role, how they felt at each touchpoint, what made them say yes or no. Both should be mapped and optimized. The funnel is the easier one to instrument quantitatively; the candidate journey is the part most teams under-measure.
What metrics should I track at each stage of the funnel?
At sourcing, track source-of-hire and applicant-to-screen yield, broken out by intake-spec category. At screening, track screen-to-interview conversion by recruiter, with rubric coverage as the secondary signal. At interviewing, track competency coverage by interviewer and interview-to-offer rate by panel composition. At offer, track time-to-offer and offer-acceptance rate by hiring manager. At hire-to-quality, track 90-day and 180-day retention against the panel signal that produced the offer. The averages do not tell you much; the slice-by-recruiter and slice-by-interviewer views are where the leaks show up.
How does AI improve recruitment funnel conversion rates?
Not by squeezing every stage. By giving the funnel report substance to stand on. The version that works in 2026 is a capture layer that runs during every interview, tags answers against the rubric for the role, and feeds a structured signal that the funnel report, the scorecard, and the interviewer dashboard all share. According to Metaview’s 2026 AI & Hiring Alignment Report, 85% of companies exceeding their hiring goals already use AI in hiring; the gap is widest at the start of the funnel, where only 49% of searches at non-AI teams begin with high alignment on requirements.