

Across 5.5 million captured conversations, AI-generated scorecards have clearly landed with recruiters: interviewers keep 77.4% of the scorecards Metaview drafts from the conversation.¹
The value shows up in a second number. Scorecards that start as a generated draft get submitted 50.3% of the time, against 28.6% for the ones interviewers write from scratch, in a same-denominator comparison of 93,502 generated and 26,498 manual scorecards.² That’s a 21.7 point gap in how often a scorecard gets submitted at all.
That gap is the whole argument here. The biggest thing a team can change about a scorecard is where it starts. The comparison is observational: it shows association, the causal question stays open, and the honest move is to treat the starting point as something to test on your own team. It’s the strongest and most consistent pattern in the data, and it’s a workflow choice any team can make this quarter.
Teams keep the draft
In a sample of 285,859 AI-generated scorecards, interviewers dismissed only 22.6% outright.¹ They rarely throw the draft away.
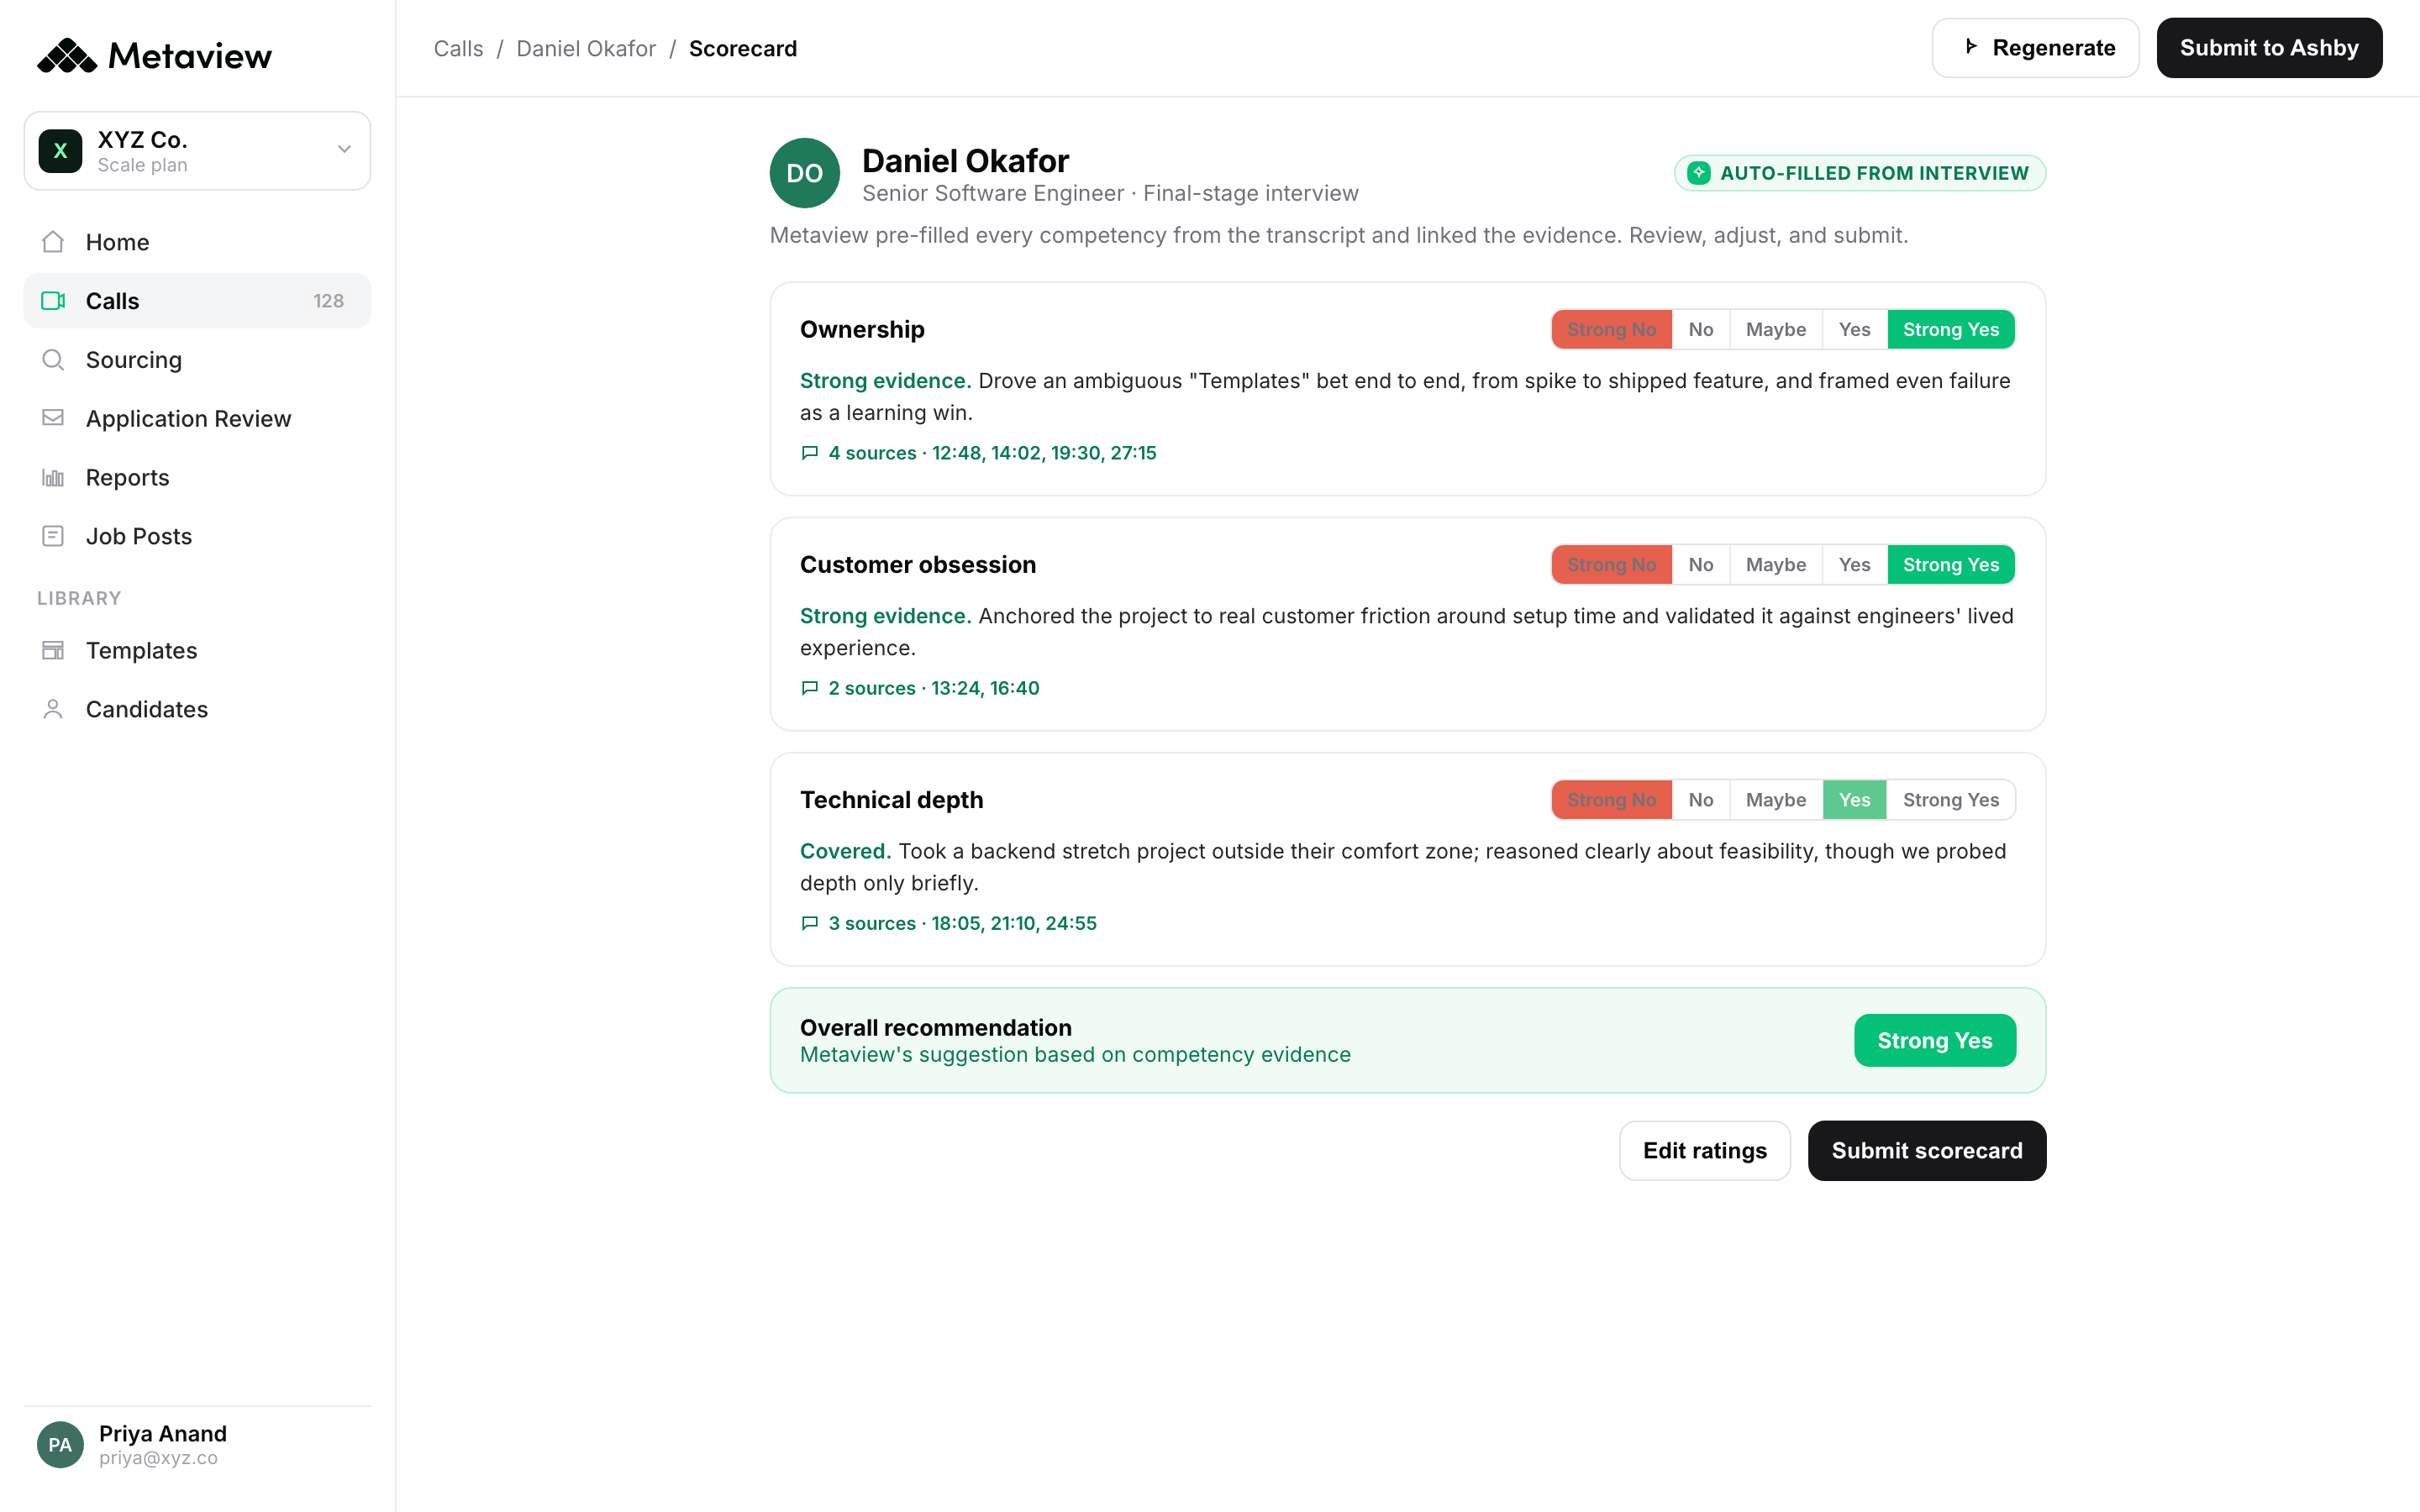
Keeping the draft is only the first step. Every generated scorecard is a stack of suggested fields: a competency rating, a piece of linked evidence, a summary line. Metaview drafts the scorecard from the conversation, and the interviewer decides what happens to each field before it’s submitted.
Run that review loop and the payoff is time back. Nitin Moorjani, who runs Talent Operations at Automattic, measured it:
The most clear impact is the time saved. Recruiters save 20 minutes per interview from wrangling notes and submitting scorecards. Per month, that’s 53 hours saved in total.”

What starting from a draft changes
Our scorecard completion study documents the clearest association in the data, and it has two parts: the submission gap at the top of this piece, and a field-count gap to go with it.
Generated drafts carried 7.85 completed fields on average. The ones interviewers wrote from scratch carried 2.61.³ The draft shows up fuller and gets submitted more often.
Our AI Notetaker captures every spoken word of the interview, so each suggestion in the draft links back to something the candidate actually said. Reviewing that is light work compared with rebuilding the conversation from memory: you’re reading and adjusting what’s already on the page.
The interviewer fixes what’s wrong, fills what’s missing, and still makes every rating themselves.
Why scorecards come back thin
Plenty of scorecards still come back sparse even when the draft is kept. Across a sample of created scorecards, interviewers filled a mean of 7.20 of the 15.17 fields a template carries.⁴ That’s roughly half the template left empty, on average, and it’s closer to the normal state of hiring documentation than a sign anything broke.
The data records what got filled and says nothing about why the rest stayed empty. So what follows is a short list of ordinary suspects, and the data can’t tell us which one dominates.
- Templates ask for more than one interview can give. A single interview rarely produces strong evidence for every field a template lists, and the leftover fields are the easiest thing on the screen to skip.
- The review happens too late. The decision already feels made by the time someone opens the draft, after the debrief or the next day. Filling the remaining fields feels like paperwork at that point.
- Suggestions show up all at once. Clearing a prefilled field takes one click, but weighing it properly takes attention, and the next call is already competing for that.
- One bad suggestion can sink the rest. An interviewer who disagrees with one suggested rating may clear everything else without auditing each field on its own.
Sometimes an empty field means the review worked. A suggested field is evidence to check, and an interviewer who clears a suggestion the conversation never supported is doing exactly the job the review step exists for.
A reviewed draft beats an empty template, and it beats blind acceptance too. What’s worth managing is whether suggestions get considered at all, and an empty-field count alone can’t tell you that.
What moves the numbers
These are the workflow choices associated with fuller scorecards. Three of them are worth testing on your own team, on top of making the draft the starting point.
Fit the template to the stage
The scorecards created in one platform sample carry an average of 15.17 fields.⁴ A recruiter screen, a technical deep dive, and a final panel don’t generate the same evidence, so a single template that size guarantees empty fields somewhere.
Trim each stage’s template down to what that stage can actually assess. The draft has less to fill, and every remaining suggestion gets easier to take seriously. Our structured interview guide covers how to pick those fields per stage, our interview scorecard template is a leaner ready-made starting point, and the interview questions piece covers which prompts earn their place.
Review while the call is fresh
Submission timing is heavily skewed. The median scorecard gets submitted 2.32 hours after the interview.⁵
The average is far longer, near a day and a half, dragged out by a long tail of scorecards that arrive days after the call. A draft reviewed in the quarter hour after the call gets checked against a fresh memory. Open it next week and you’ll skim it.
The cheapest experiment on this list is booking the review into the interviewer’s calendar as part of the interview itself. The habit is also part of what separates a good interviewer from a bad one. A consistent interview notes template keeps that review quick if your interviewers take their own notes on top of the draft.
Track what happens to suggestions
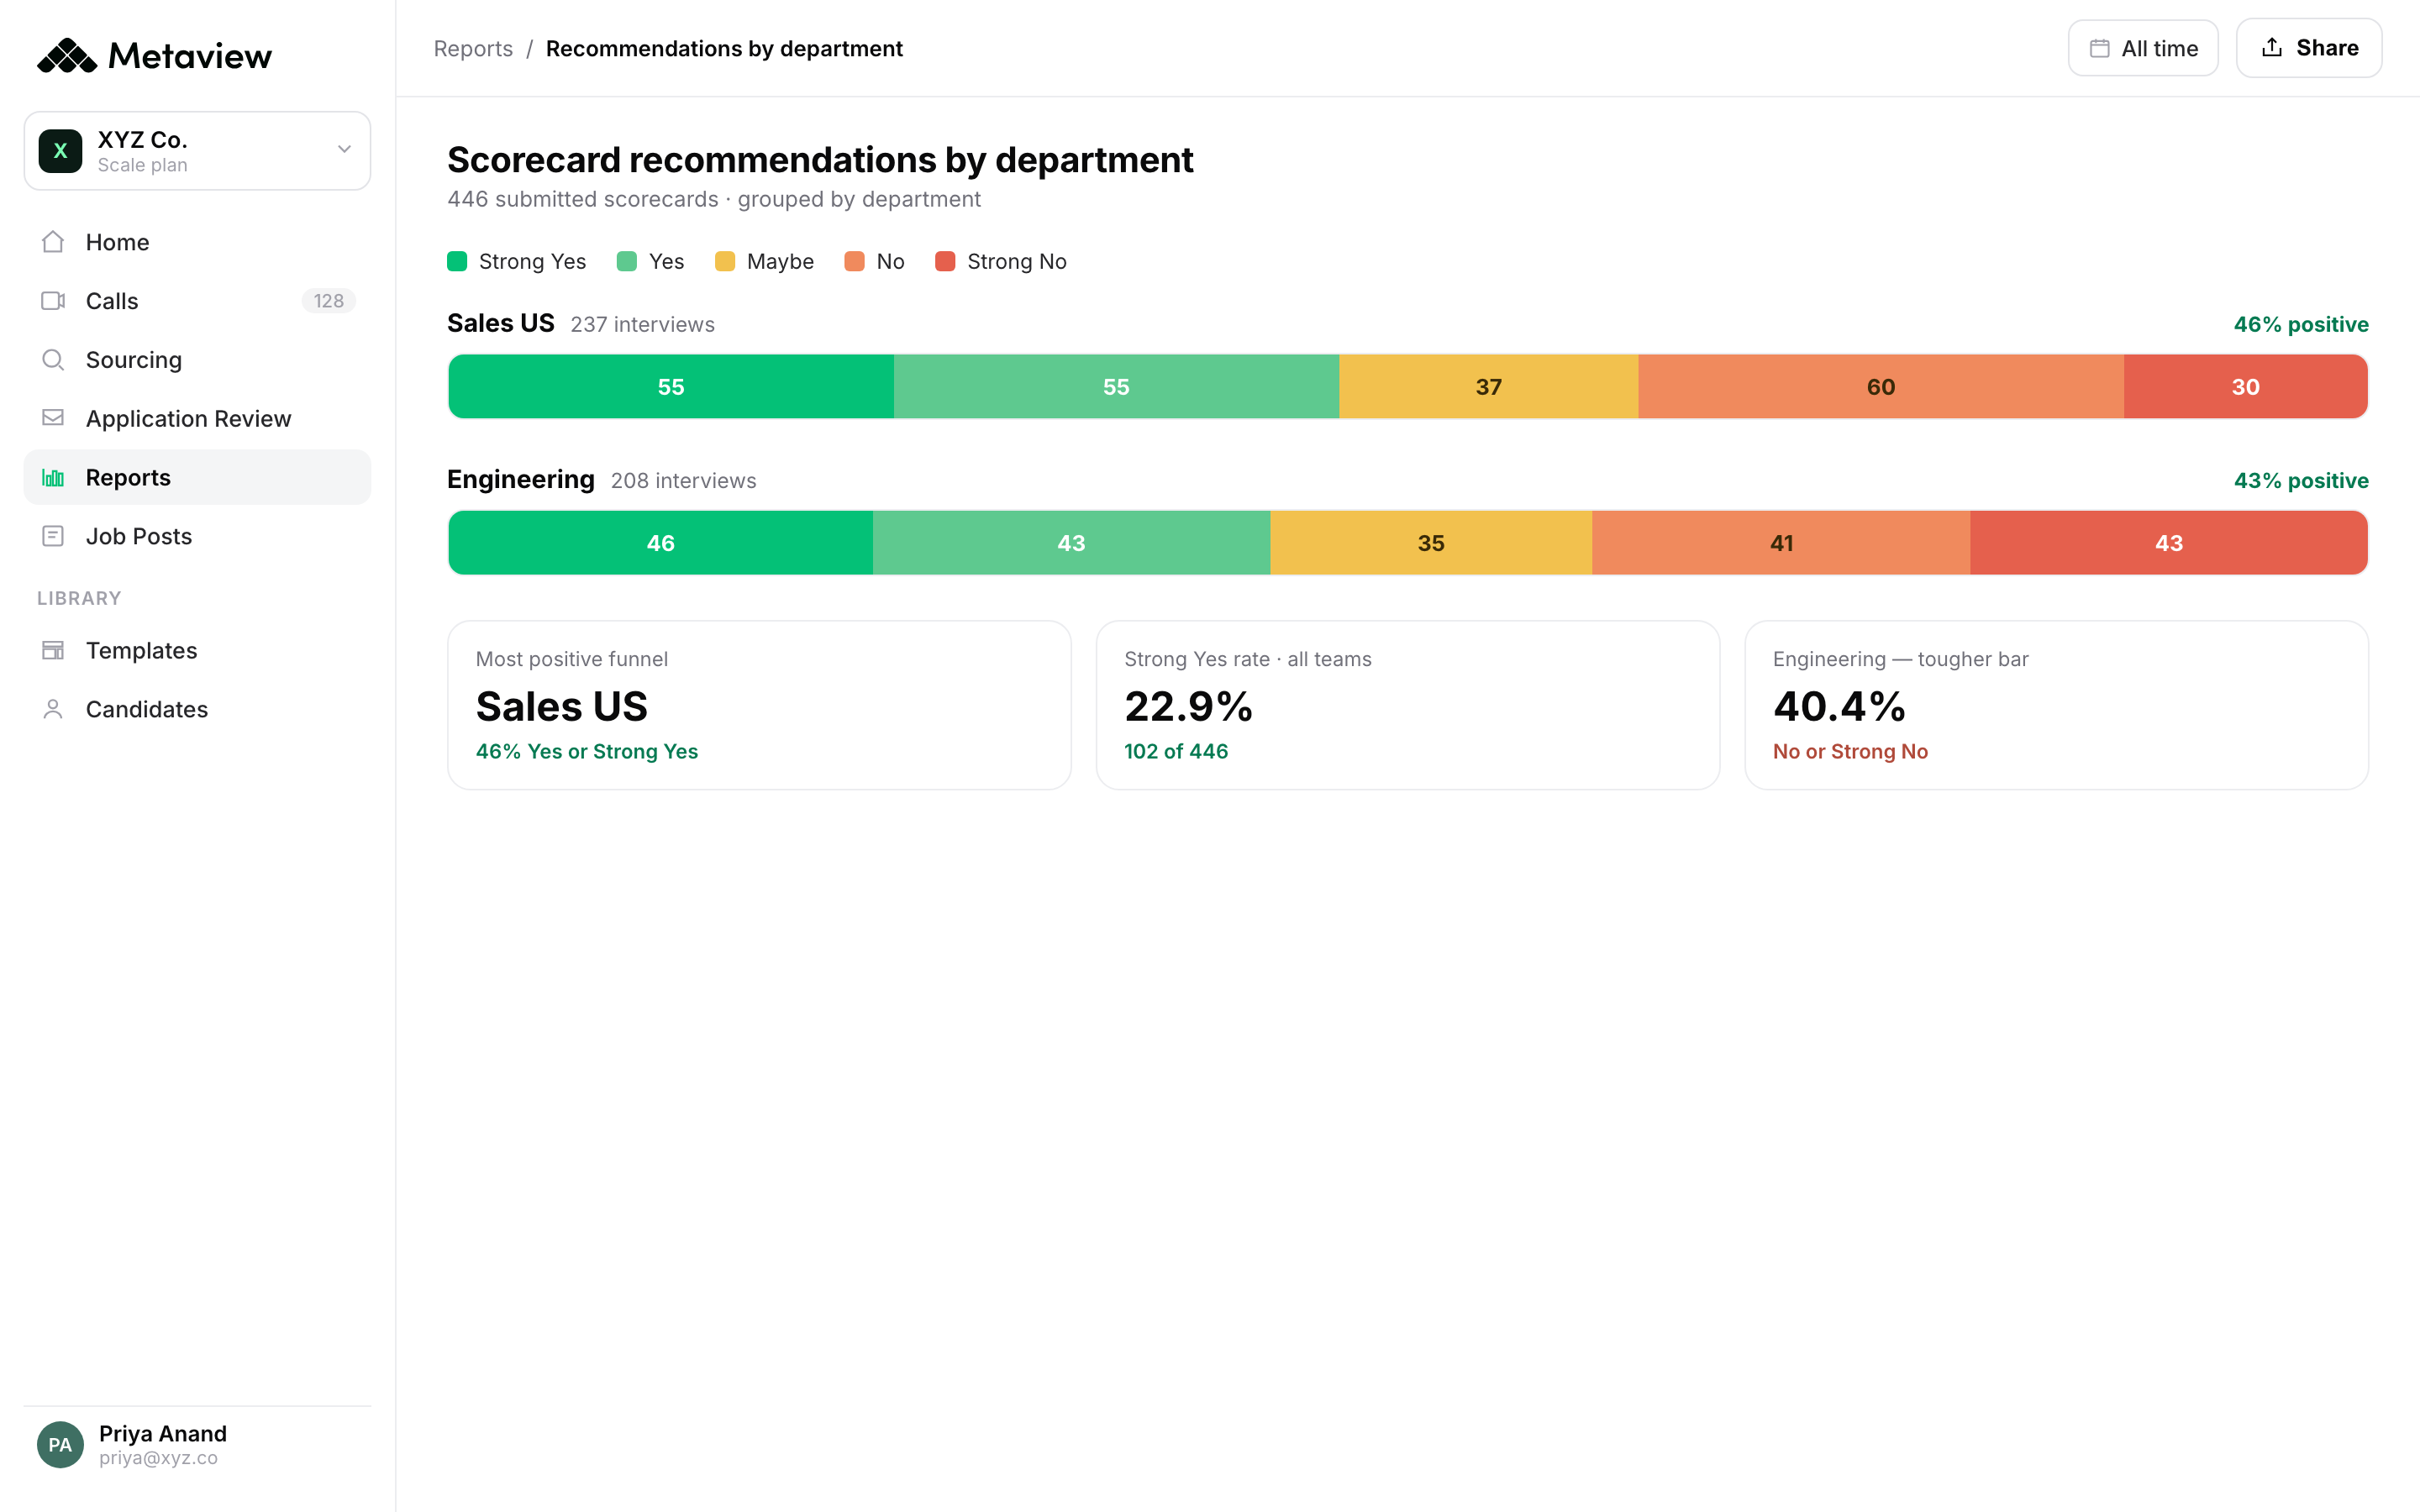
You can’t manage a review step you can’t see. Metaview Reports breaks scorecard behavior down by team, stage, and interviewer: coverage, submission, recommendation mix, and how long feedback takes to land.
If one department leaves most suggested fields empty while another accepts nearly everything as-is, those are two different conversations to have. The report tells you which one you’re walking into.
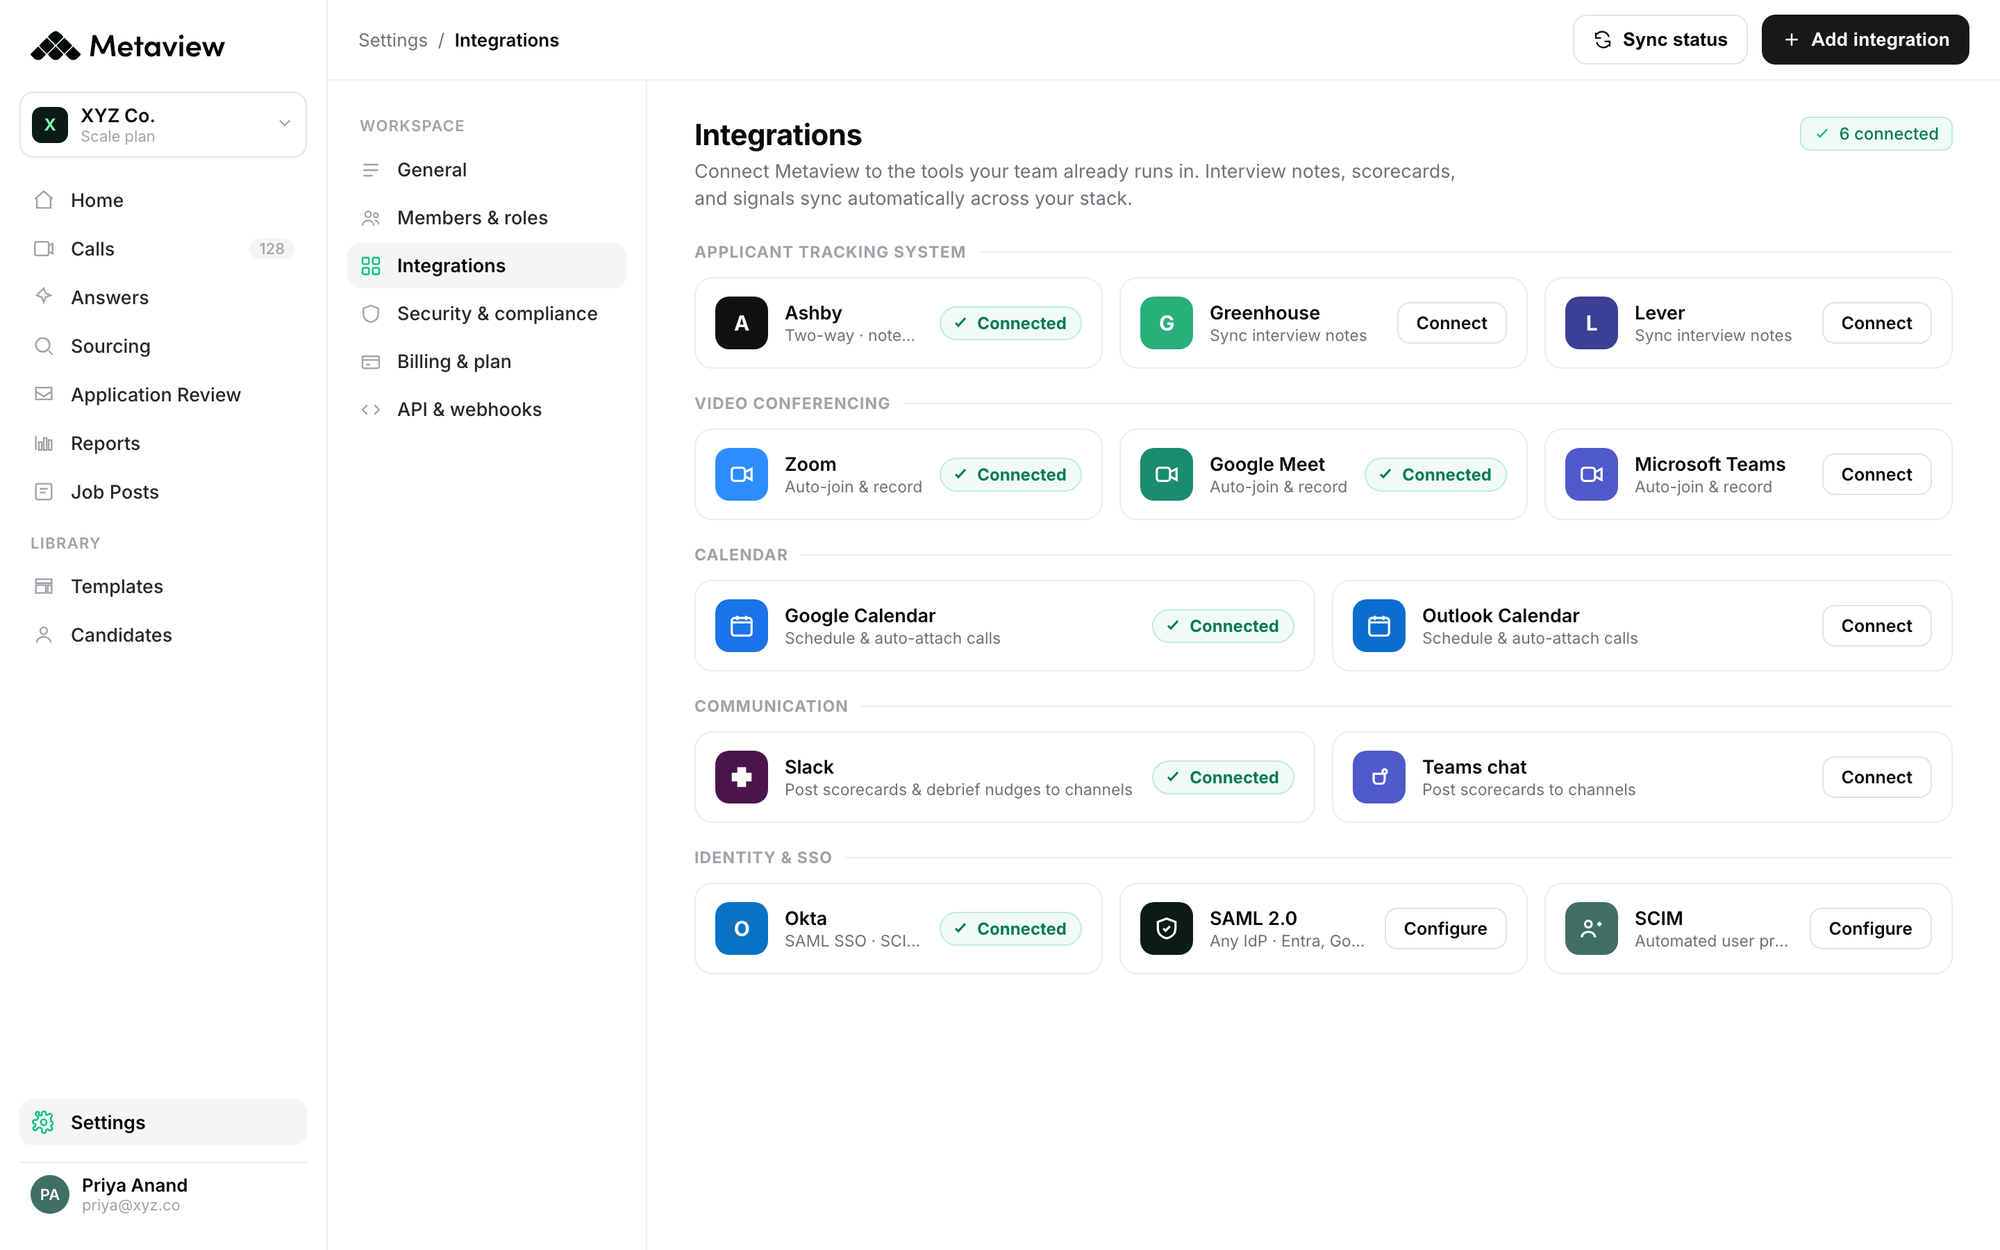
Adoption also depends on where the scorecard lives. Metaview connects to your ATS, calendar, and video tools through its integrations (find them under Settings, then Integrations), so a reviewed scorecard lands in the system your hiring team already works in. No extra tab.
Where to start
Pull 90 days of your own numbers before changing anything: the share of interviews that get a scorecard at all, the submission rate on generated drafts, and how completely those scorecards come back. One of them will stand out as the weakest.
Then run the cheapest fix first. Scorecard delays pile up downstream, all the way into time to fill, so the fastest win usually sits closest to the interview itself. For most teams the weakest number is the review step, which is lucky, because it’s also the cheapest one to fix.
See where your scorecard adoption stalls.
Review coverage, submission, and how completely scorecards come back across your own hiring team in Metaview.
Frequently asked questions
Does Metaview score candidates on its own?
No. Metaview drafts the scorecard from the conversation and links each suggestion to what was said. Recruiters and hiring managers review the draft, edit it, and make every rating and recommendation themselves.
Why do interviewers keep the AI draft but still leave fields empty?
Keeping the draft and filling every field are separate decisions. A single interview rarely produces evidence for every field a large template lists. Reviews that happen days after the call get skimmed, and an interviewer who distrusts one suggestion may clear several at once. A blank field can be the right call when the conversation didn’t support a rating.
What is the most reliable way to raise scorecard submission?
Start the scorecard from a generated draft instead of a blank template. In the data, it’s the workflow choice most strongly associated with scorecards getting submitted and coming back fuller. Fitting the template to the interview stage, reviewing while the call is fresh, and tracking submission by team are the next things to test on your own numbers.
What data are these AI scorecard findings based on?
The figures come from aggregated, anonymized Metaview product data covering roughly 5.5 million captured conversations, about 5.2 million of them candidate interviews. Sample sizes for each figure are in the footnotes. No individual, company, or candidate is identifiable.
¹ Scorecard-level kept rate: 285,859 AI-generated scorecards; 77.4% kept, 22.6% dismissed. ² Submission comparison: 93,502 AI-generated and 26,498 manual scorecards; 50.3% of generated versus 28.6% of manual submitted. A same-denominator comparison. ³ Completed-field comparison: a separate 80,000-scorecard sample; generated drafts carried a mean of 7.85 completed fields against 2.61 for manual ones. ⁴ Scorecard completeness: 13,373 created scorecards; a mean of 7.20 of 15.17 fields filled. ⁵ Submission timing: 811,298 submitted scorecards; median 2.32 hours from interview to submission, mean 36.16 hours. Source: Metaview’s corpus of roughly 5.5 million captured conversations (about 5.2 million candidate interviews), 2026. All figures are aggregated and anonymized. Every comparison in this piece is observational.
