
Among the five employee bands, interviews captured in the 1,000-to-5,000 band are longest on both measures, leading the runner-up by 1.5 minutes on each. This comparison covers interviews captured on Metaview at customer organizations whose company size is known from Salesforce records. It doesn’t describe the industry or all customers.
The mean spans 3.0 minutes (+8.0%) across the five bands, while the median spans 3.8 minutes (+11.2%). The two smallest bands are near-flat. Both measures are highest in the 1,000-to-5,000 band and fall back at 5,000+.
Interview length differs across these bands, but the snapshot can’t explain why. It also can’t show how one company’s interviews change as it grows.
The five bands in full
The five-band base contains 5,283,343 interviews across 10,121 size-matched customer organizations. It doesn’t include the separate unknown-size row.
| Employee band | Interviews | Organizations | Mean minutes | Median minutes |
|---|---|---|---|---|
| 1-50 | 1,280,153 | 5,095 | 37.4 | 34.0 |
| 51-200 | 980,683 | 2,324 | 37.5 | 34.0 |
| 201-1,000 | 1,688,687 | 1,651 | 38.9 | 36.3 |
| 1,000-5,000 | 890,944 | 693 | 40.4 | 37.8 |
| 5,000+ | 442,876 | 358 | 38.4 | 35.5 |
The 201-1,000 band supplies the largest slice of the base, with 1,688,687 interviews, or 32.0%. A separate unknown-size row contains 22,323 interviews across 433 organizations. Those records aren’t folded into any known-size band.
About the data. This is an interview-weighted snapshot of interviews captured on Metaview. Company size is known from Salesforce records. The five-band base doesn’t cover the industry or all customers. The unknown-size row sits outside it and represents 0.42% of interviews and 4.10% of organizations. Interviews per organization run from 251 to 1,286 by band, so organization-level concentration can’t be tested from this table.
Where is interview length highest?
The 1,000-to-5,000 band holds the highest mean and median, leading the runner-up by 1.5 minutes on each. The two smallest bands share the same median, while their means are 37.4 and 37.5 minutes.
The mean for the 1,000-to-5,000 band is 40.4, compared with 38.9 for the runner-up 201-1,000 band. Its median of 37.8 also leads the runner-up value of 36.3 by 1.5 minutes.
The 5,000+ band falls back from that peak. Its mean of 38.4 is 2.0 minutes below the 1,000-to-5,000 result, while its median of 35.5 is 2.3 minutes lower.
Across all five bands, the mean spread is 3.0 minutes, from 37.4 to 40.4, with the largest value 8.0% above the smallest. The median spread is 3.8 minutes, from 34.0 to 37.8, with the largest value 11.2% above the smallest.
“Enterprise interviews run long” is folklore this table does not support. Although the 5,000+ employee band sits above the 1-50 employee band on both mean and median, the largest band is not the longest. Both measures peak one band earlier, and this snapshot doesn’t show a steady ordering of interview length across size bands.
The table cannot justify the opposite claim that company size tells you nothing. It shows small differences in mean and median values across the bands, but it cannot explain them. Nothing in this snapshot supports planning for longer interviews as companies grow, so teams should set interview length from their own process requirements.
What the table does not say
The output measures interview and organization counts, plus mean and median length. It doesn’t measure any mechanism that could explain the differences across bands, so company size can’t be assigned as the cause.
The snapshot has no period column. It doesn’t follow organizations as they grow.
The rows weight interviews rather than companies. The output doesn’t include an internal distribution or concentration measure, so a band value can’t define a normal result for one organization.
The captured population shows interview-length variation across employee bands. The table can’t assess whether those gaps affect scheduling or interviewer workload. Its scope stops at Metaview customer organizations with a Salesforce size match.
Using the table with your own data
Start with a defined period, and include only captured interviews with a recorded actual length. Don’t mix in scheduled times when you calculate the mean and median for that set.
Use the published employee-band row as context for those results. It is an interview-weighted all-time aggregate, and the source does not report the within-band distribution needed to decide whether one organization’s result is unusual.
Read the mean and median together. The mean preserves the effect of longer conversations, while the median identifies the midpoint value. If they tell different stories in your own data, inspect the underlying interviews before assigning an explanation.
Report scheduled duration and actual duration separately. Then cut the same records by stage and function, using categories you can verify in your own system. But those cuts describe your records; the published table doesn’t measure either factor and can’t support either as the explanation.
If your result differs from the relevant band, record the difference and stop there until your own data supports an explanation. Don’t turn the published value into a target or benchmark, and don’t use it to predict one team’s result.
Where Metaview fits
With Metaview Reports, a team can query its own interview data in-product or through the Metaview MCP. The aggregate in this article remains separate and cannot make that comparison for the team.
The Deel case study shows Metaview Reports used with the company’s own interview data. This product-use example does not describe the 5,000+ aggregate row.
When consent is given, the Metaview Notetaker joins a recorded interview as a visible participant and captures every spoken word. That gives the team a transcribed interview record it can use to calculate mean and median duration for a defined period. The same records can support other recruiting benchmarks chosen for the process being reviewed.
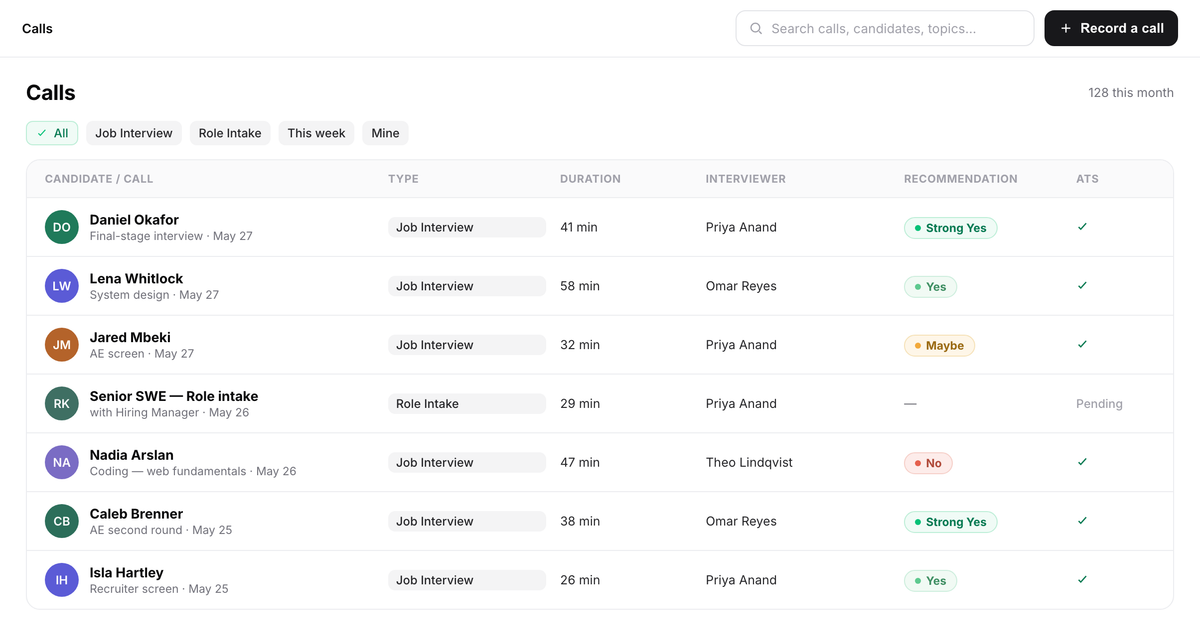
- 1The Duration column shows the recorded length of every visible call. All except one are Job Interview records; the other is Role Intake.
- 2The call type label separates Job Interview records from Role Intake, the non-interview case shown.
- 3The Recommendation column shows the interviewer’s submitted recommendation alongside the record.
The band values establish context for size-matched customer organizations, but they don’t diagnose one team’s process. A comparison is useful only when the team defines its own period and calculates both measures from its captured interviews.
Query a defined period in Metaview Reports, then calculate your team’s mean and median from the actual recorded interview lengths. Inspect stage, function, and scheduled duration against those results.
Capture the interviews behind your own numbers.
Metaview’s Notetaker joins interviews as a visible participant, records and transcribes them, and creates structured notes.
Frequently asked questions
What does captured on Metaview include and leave out?
A captured interview is a recorded interview available in the analysis. Interviews that were not captured are absent, so the analysis cannot estimate how much of an organization’s total interview activity it covers.
Why is the unknown-size group excluded from the comparison?
A comparison by employee band requires a known size match. The unknown-size group cannot be assigned to a band from the available Salesforce record, so keeping it separate avoids guessing where those interviews belong.
Does the employee band refer to the hiring organization or the candidate?
The band refers to the Metaview customer organization associated with the captured interview. It does not describe the candidate’s current or previous employer.
Can these results compare individual interviewers?
No. The rows group interviews by the employee band of the customer organization. Comparing interviewers would require the team’s own interviewer-level records and a definition of which calls belong in the comparison.
