
Sixty-seven percent of recruiting teams lose qualified candidates to faster-moving competitors every month, according to Metaview's 2026 AI & Hiring Alignment Report - surveying 505 recruiting leaders and hiring managers across North America and EMEA. That candidate loss is the most expensive line on your cost-per-hire sheet, and it doesn't appear on any cost-per-hire sheet.
Cost per hire is usually presented as an arithmetic problem: total recruiting spend divided by hires made. The formula is right. The framing is wrong. The internal-cost column dominates, and inside that column, two activities dominate again: recruiter admin (scorecards, notes, debrief coordination) and panel labor (interview rounds, calibration, hand-offs). Job-board spend is loud but small. Recruiter and hiring-manager hours are quiet and large.
This post walks the actual math, ranks the eight places budget leaks (with how much you should expect to get back), and shows how Metaview customers like Brex, Trainline, and Workleap have reduced cost per hire without reducing hiring quality. None of the numbers below are projections. Every customer figure traces to a named case study or live testimonial.
Cost per hire is real math, and the formula hides where the money goes
The standard formula is correct. Total recruiting cost in a period divided by hires made in that period. Stack-rank it on a spreadsheet and a number falls out. The arithmetic is not the problem.
The problem is what the formula obscures. Recruiting cost has two columns. External cost is the visible one: agency fees, job boards, assessments, the ATS license, the LinkedIn Recruiter seat. It is the column finance asks about because it has invoices attached. Internal cost is the column nobody invoices: recruiter hours spent on scorecards, hiring-manager hours spent on debriefs, the time a senior IC loses to a screening call that should have been auto-triaged.
On most teams the internal column is the bigger one. Recruiter labor at fully loaded cost, hiring-manager hours at engineering or sales loaded cost, and the compounding cost of slow loops (the 67 percent stat above) make the internal column 60 to 80 percent of the real CPH. That is where you should be looking when CPH creeps up. Not at the LinkedIn Recruiter renewal.
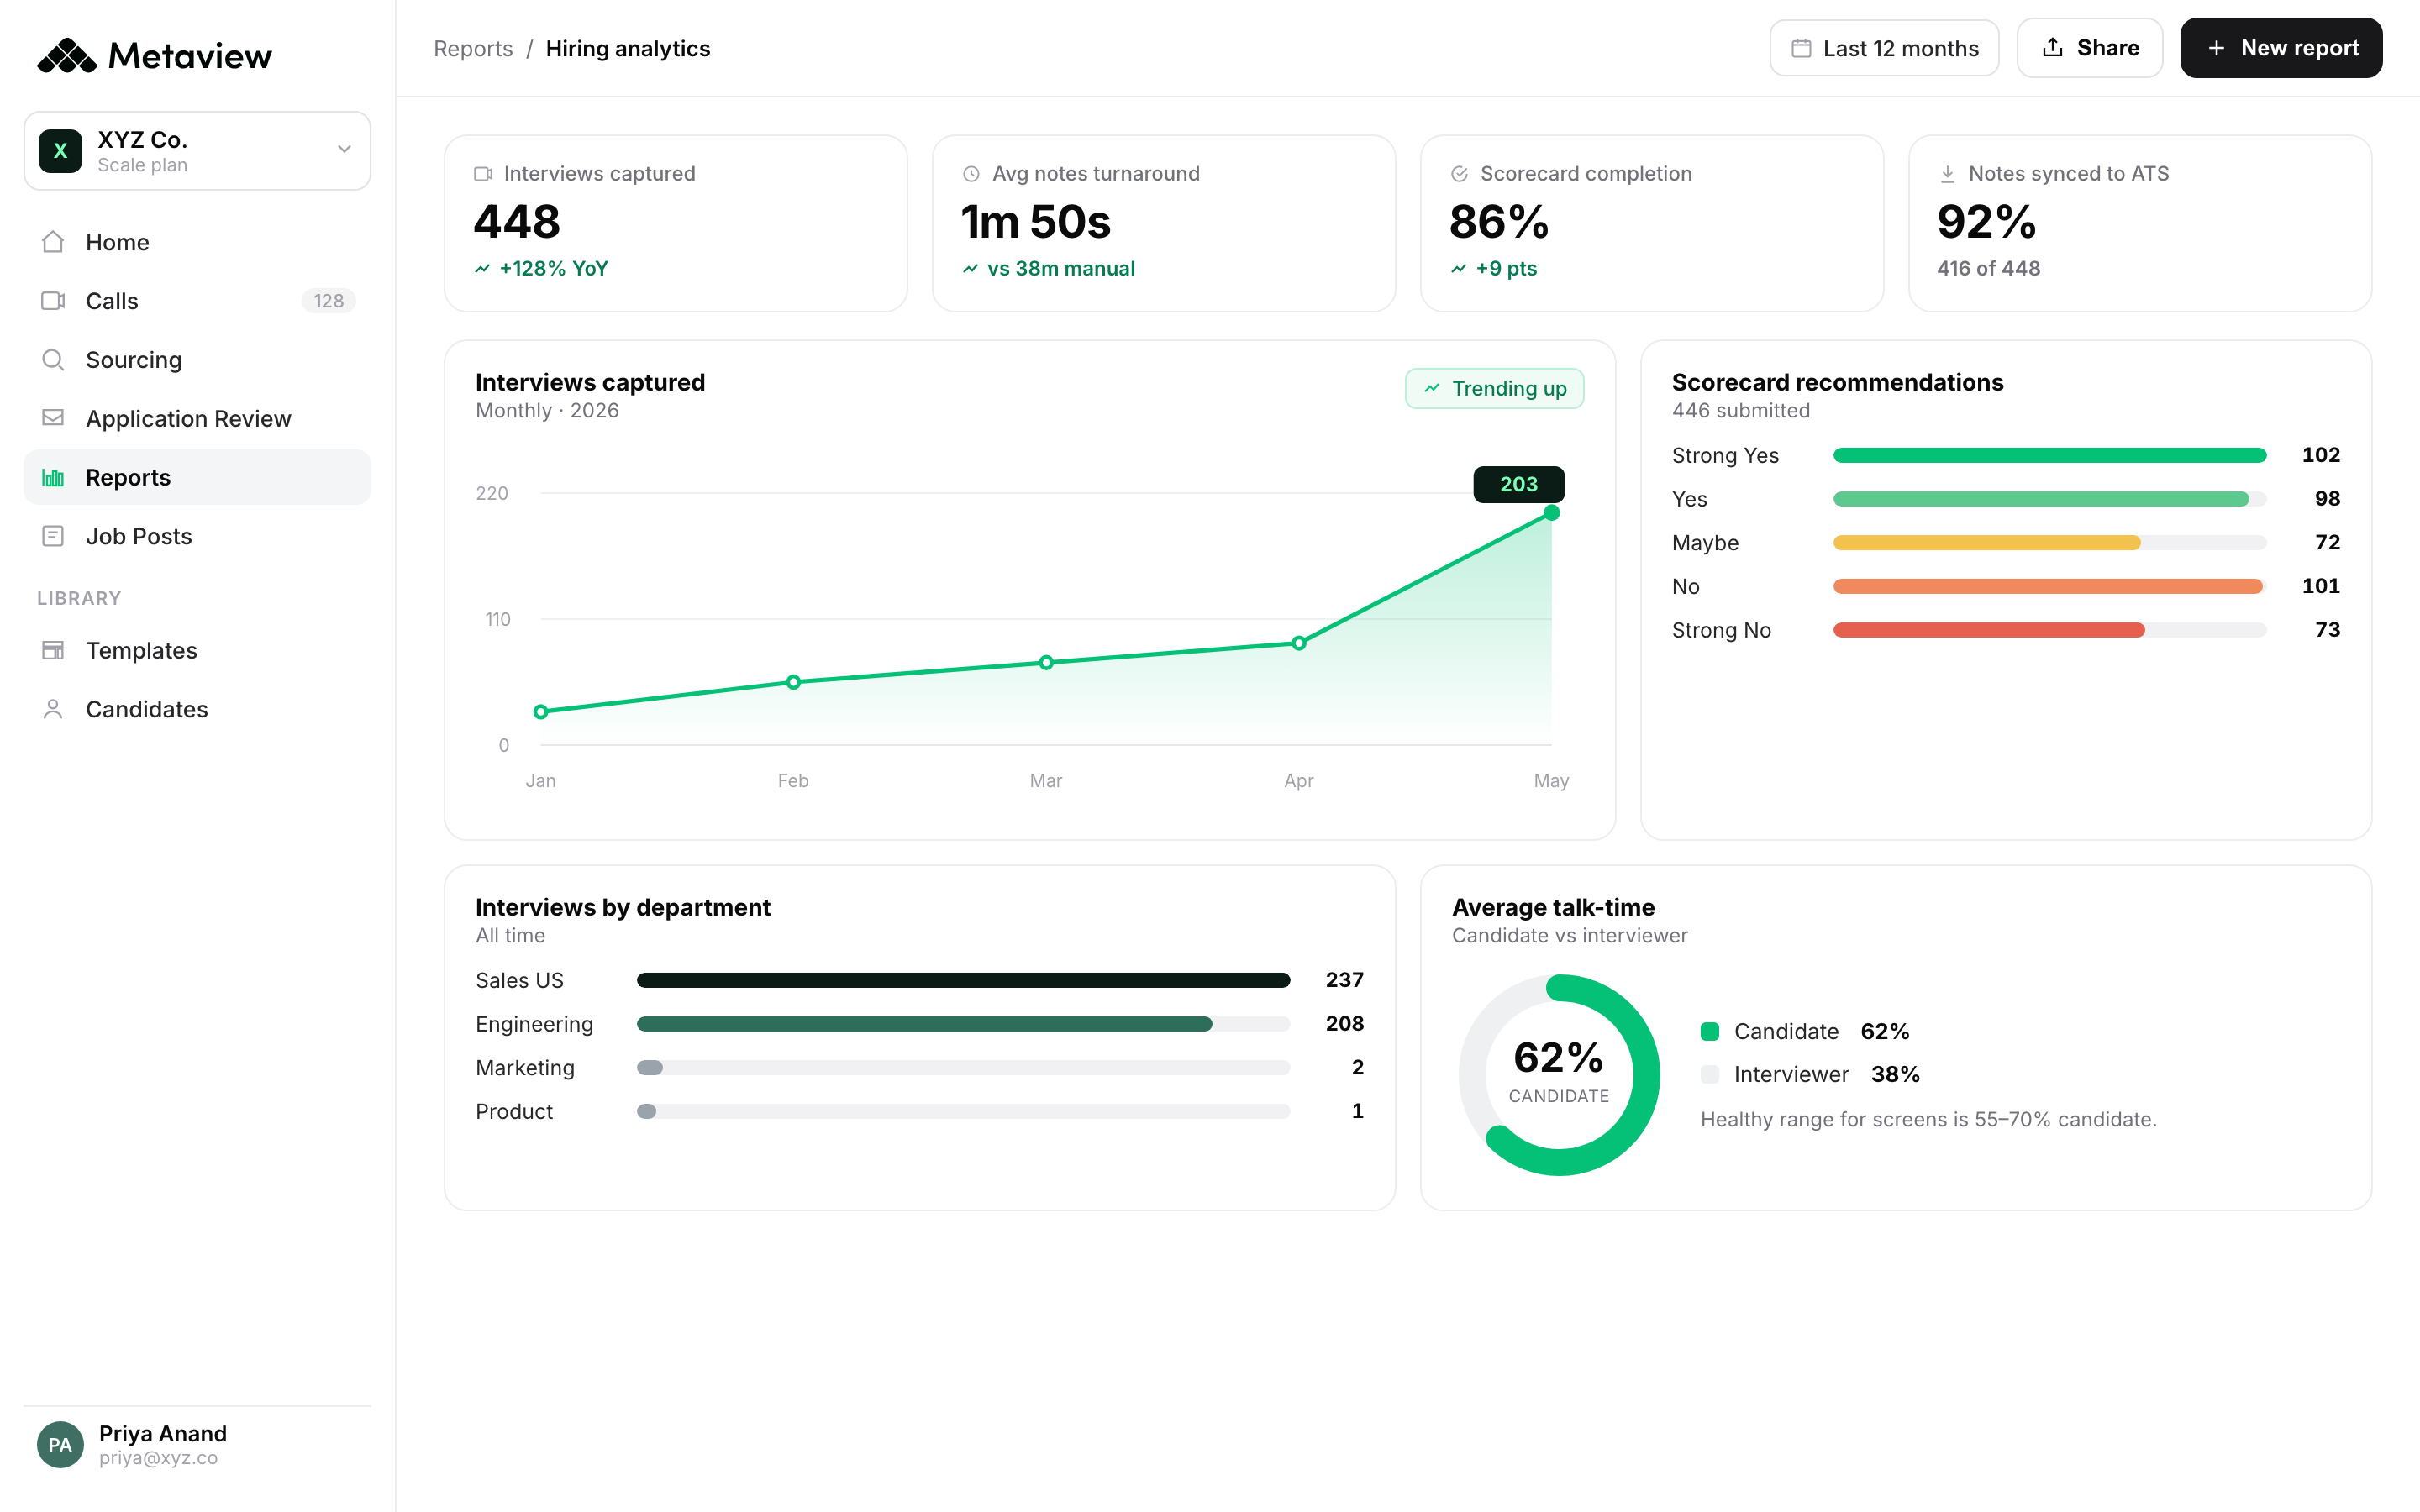
This is what Metaview's Reports surface makes visible without an analyst pulling a custom dashboard. Interview load per role, per stage, per interviewer. Time to debrief. Time to decision. The labor side of CPH stops being implied and becomes operational.
The eight leaks, ranked by how much you will get back
Not every line item on CPH has the same payback. Some are operational levers you can move in 30 days. Others are structural and take a year. The ranking below is by how fast a typical team can claw back budget, based on what we see across Metaview's customer base.
1. Recruiter admin hours (biggest payback, weeks)
This is the line every TA leader underestimates. A recruiter who runs 8 to 12 interviews per week spends 6 to 10 of those hours writing up scorecards and editing rough notes after the call. Workleap's Senior Recruiter Johnny Drexhage cut his screening time by 50 percent after switching that workflow to AI. Integria Consulting's Director of Talent Acquisition Samantha Bateman saves 45 minutes per interview just on note write-ups. Multiply by interview volume: one mid-sized team's worth of saved labor.
2. Panel size and interview-round count (huge payback, weeks)
Every extra round on a loop is recruiter labor, hiring-manager labor, candidate friction, and CPH inflation. The teams that reduce interviews-per-hire after rolling out structured capture don't do it by skipping signal. They do it by trusting the structured scorecard from earlier rounds and not re-litigating in the next one.
3. Decision lag (large payback, weeks)
The 67 percent candidate-loss number above is mostly a decision-lag problem. A candidate who waits 5 days for a debrief decision is roughly twice as likely to accept a competing offer as one who waits 2 days. Lag is operational. It is also the most-fixable line on the CPH sheet.
4. Mis-hire cost (huge payback, but slow to surface)
A mis-hire costs 1 to 2 times annual salary in re-fill, ramp-down, and ramp-up. Most CPH calculations exclude this entirely because it is recognized in the next quarter, not the current one. Structured scorecards and AI-flagged interview consistency reduce the variance that produces mis-hires. The payback is delayed but enormous.
5. Agency over-reliance (medium payback, months)
Agencies are a symptom, not a strategy. Teams that use agencies for 30+ percent of hires usually do so because their sourcing or screening capacity is constrained, not because the agency network is uniquely strong. Fix the capacity constraint and the agency line drops.
6. Scheduling churn (small payback, weeks)
Calendar coordination across 5 to 7 panelists, candidate calendars, and recruiter coordination is real labor. Scheduling automation is cheap, fast to deploy, and broadly available. This is the easiest line to move, but also the smallest dollar amount.
7. Stale ICPs (medium payback, slow)
If the intake brief sets the wrong target, every hour spent sourcing, screening, and interviewing against that brief is wasted. ICP drift compounds. The fix is in the intake meeting, not the funnel.
8. Channel reshuffles (smallest payback, months)
This is the line most CPH posts focus on. It is also the one with the smallest swing for the average team. Job boards, ad spend, employer-brand campaigns matter at the margin. They are not where the recruiting dollar lives.
Hire the best candidate for the job and do everything you can to do a fair evaluation. If that silver is indeed the best candidate, great. But don't always prioritize speed. It's time, cost, quality.”
The biggest leverage: cutting recruiter admin without cutting recruiter quality
Of the eight leaks, recruiter admin is the one TA leaders consistently underestimate the size of. Not because they don't see it (they live it every week), but because it shows up as labor cost rather than line-item cost. When you ask "how do we cut CPH?" nobody answers "reclaim 12 hours per recruiter per week." But that is the answer.
The two recruiter activities that move CPH most are structured capture (notes during the interview that become scorecard inputs without re-typing) and structured debrief (a panel decision that anchors to the rubric, not the loudest opinion in the room). Both are AI workflows. Neither requires you to take a human out of the loop.
Application Review is the upstream version of the same pattern. ICP-fit scoring on inbound applications, structured triage that surfaces the top 10 percent rather than the bottom 90, and a Reject or Progress action inline. Recruiter labor moves out of triage and into the conversations that actually move offers.
- Recruiters spend 6 to 10 hours per week on scorecard write-ups and note clean-up
- Inconsistent interviewer prep drives 5 to 7 rounds per hire
- Hand-typed notes lose detail, triggering re-interviews
- Senior recruiters screen inbound applications manually
- Scorecards drafted automatically from the interview audio
- Standardized interview brief generated from the intake call
- Structured AI notes plus searchable transcript per interview
- ICP-fit triage surfaces the top inbound, recruiters skip the bottom
Manual, generic AI, Metaview: the cost stack compared
Three operating models cover most of the market. They have very different labor profiles. The dimensions below are the ones that move CPH the most.
| Dimension | Manual | Generic AI notetaker | Metaview |
|---|---|---|---|
| Note-taking labor per interview | 30 to 60 min | 15 to 30 min | under 5 min |
| Scorecard turnaround | 1 to 3 days | same day | within hours |
| Interview rounds per hire | 5 to 7 | 4 to 6 | 3 to 5 |
| Inbound triage labor (hrs/week per recruiter) | 8 to 12 | 5 to 8 | 1 to 3 |
| Re-interview rate (notes lost) | 10 to 20% | 5 to 10% | under 2% |
| Mis-hire variance | high | medium | low |
What customers actually see on the CPH line after switching
The customer numbers in this post are not aggregates or extrapolations. They are named cases with named operators.
Brex is the clearest scale data point. After scaling Metaview to every interviewer and every recruiter, the team saved 1,000+ hours per year, and Brandon Miles, Head of Executive Recruiting at Brex, says he doubled his per-recruiter efficiency. The case study is here.
Brex is not an outlier. Trainline's Talent Acquisition Lead, Aaron Walker, gives the cleanest CPH math we have seen from a customer in their own words:
We probably save around 10 minutes per interview, maybe a bit more. We do between 300 and 500 interviews a month. That works out to 50 to maybe 80 hours saved for the business per month. That's a significant time and cost saving.”
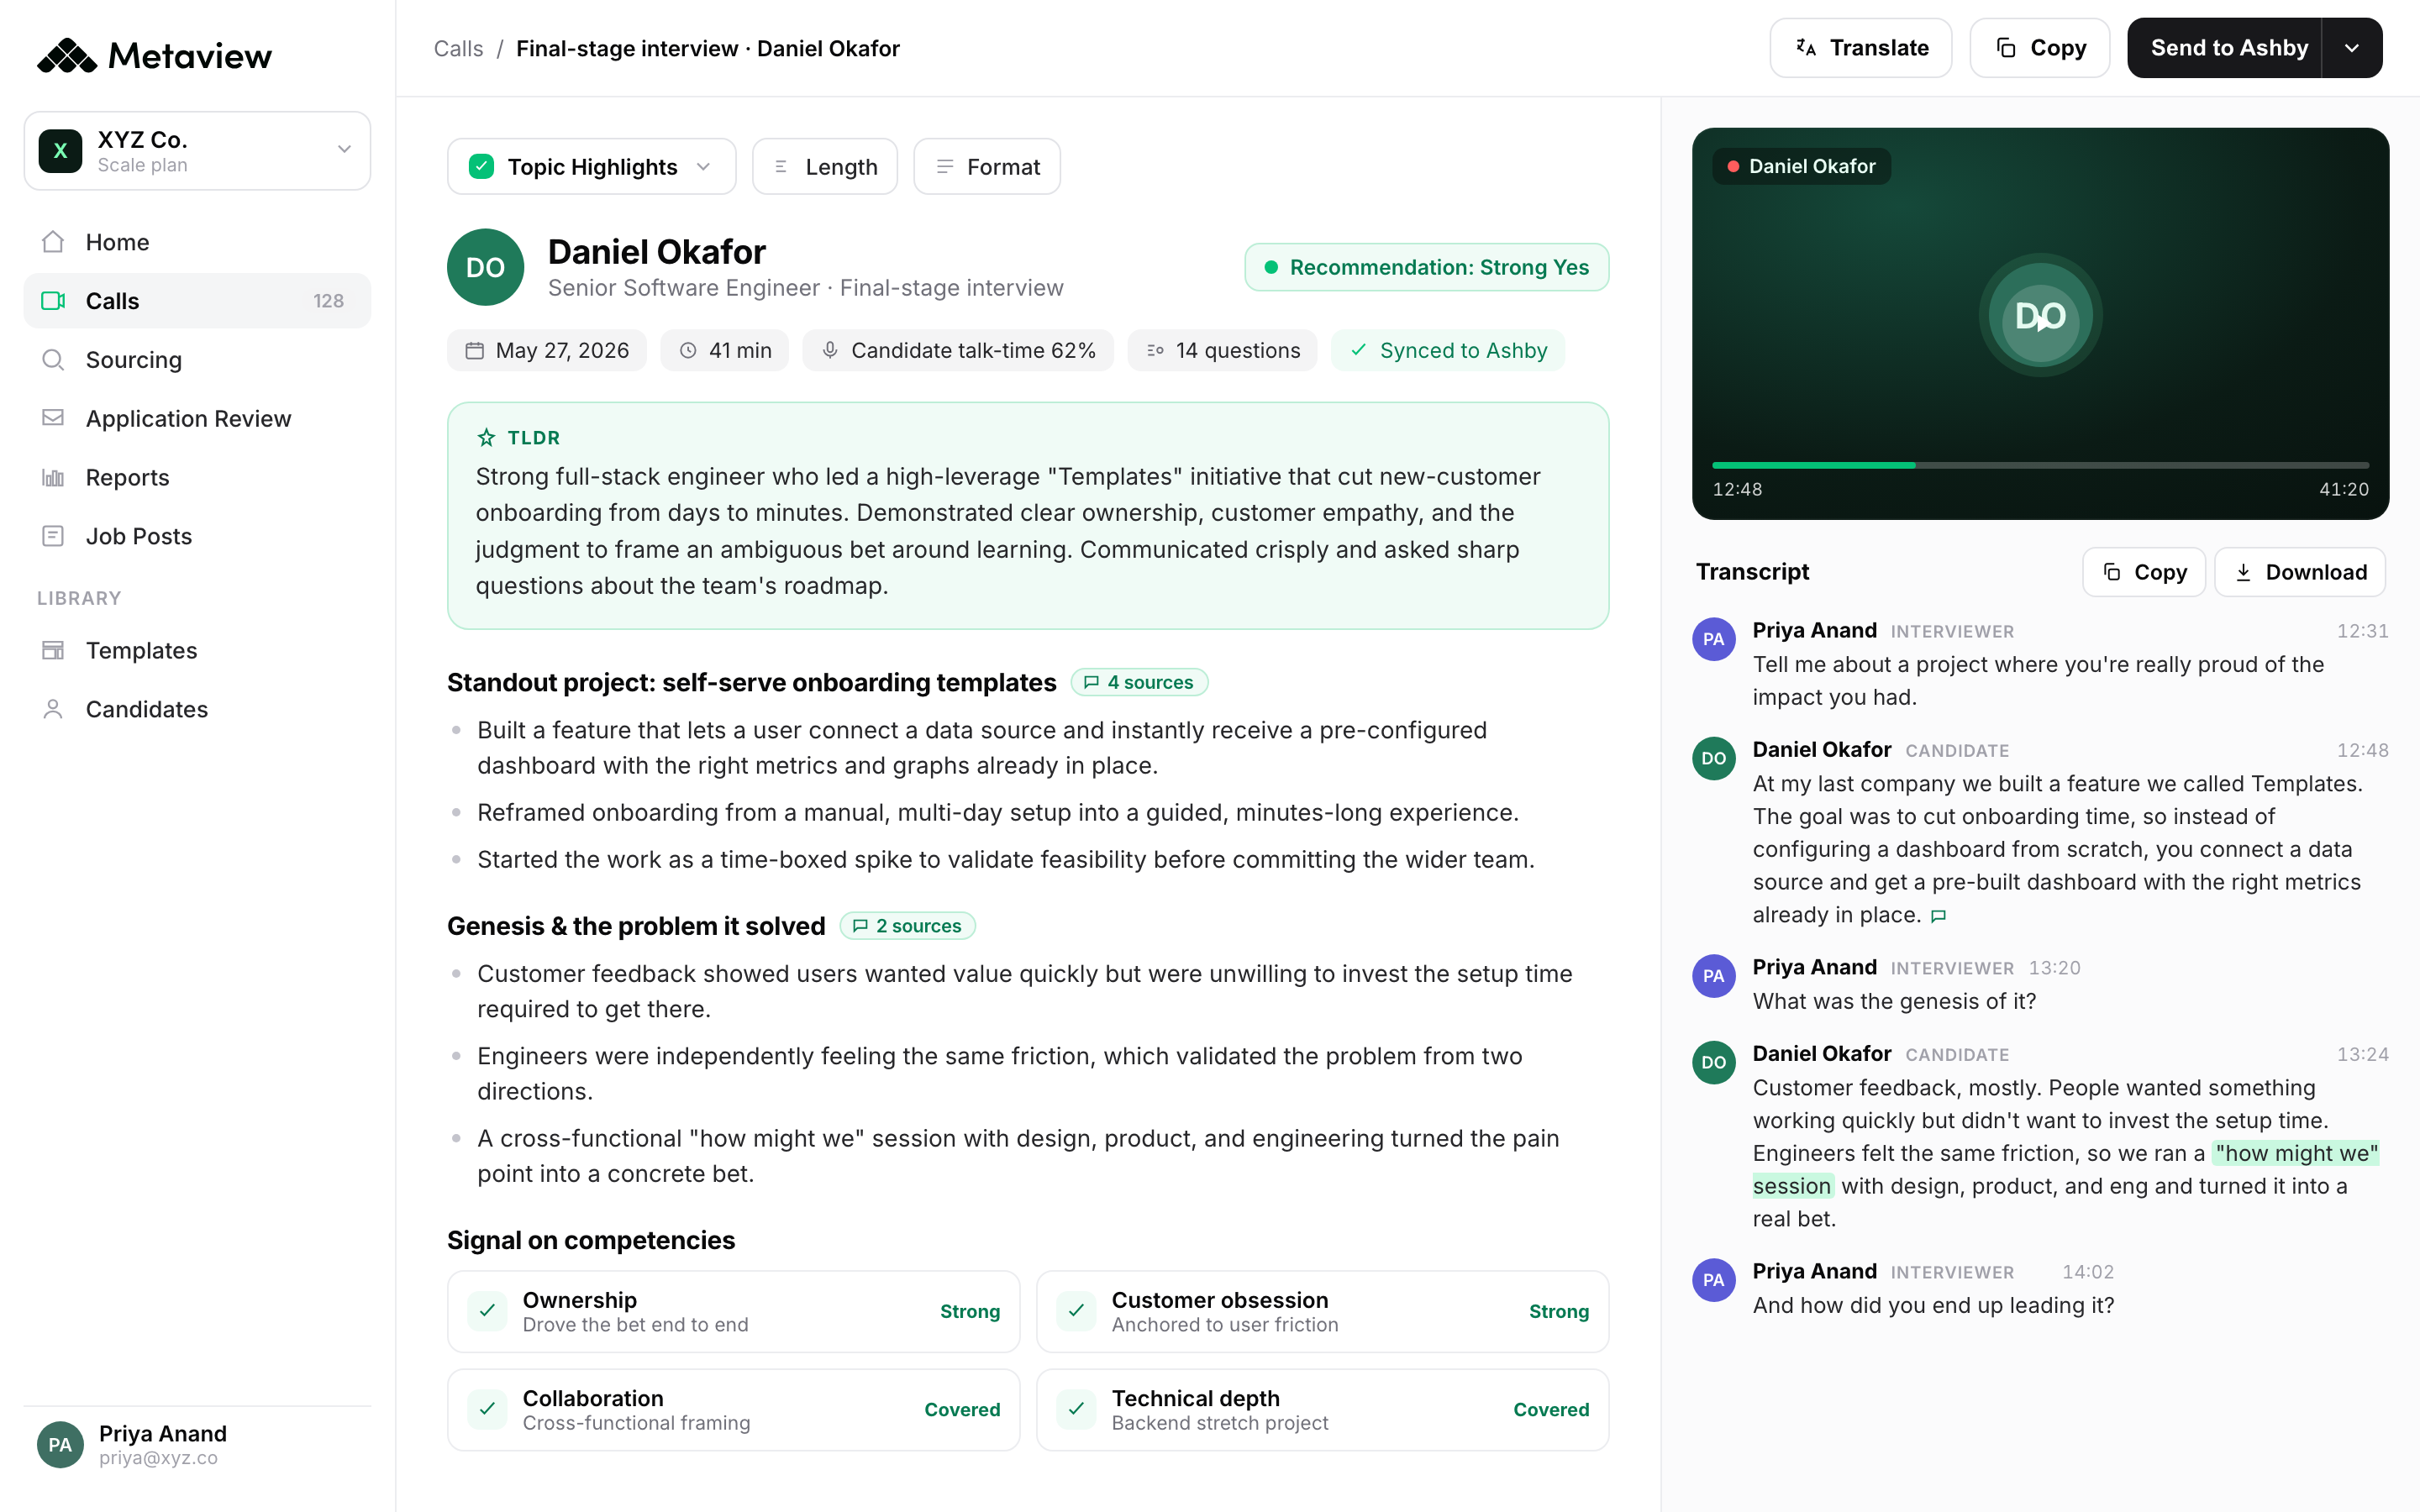
- 1Auto-written Q&A summary lands in the post-meeting view within minutes. This is the workflow that gives Integria 45 minutes per interview back.
- 2Topic chips let the hiring manager scan to the section they need without watching the recording.
- 3The recording stays linked for evidence. Re-interviews because notes were lost become a sub-2 percent event, not a 10 to 20 percent one.
Your 30-day CPH audit: the questions to run by Friday
If you want to cut CPH and you have 30 days, run these questions through your operating data. Most are answerable from your ATS plus your interview-intelligence layer (Reports, in the Metaview case). The threshold after each one is the lever you should pull first if you're above it.
- Average interview rounds per hire, by role family. Above 5? That's the first lever.
- Median time from final round to offer. Above 2 business days? That's the second lever.
- Recruiter hours per week on scorecard write-up and debrief coordination. Anything above 8? That's the third lever.
- Share of inbound applications individually reviewed by a senior recruiter. Above 30 percent? That's the fourth lever.
- Share of hires through an agency in the last 90 days. Above 30 percent? Capacity is the issue, not sourcing.
- Days from intake to first candidate in pipeline. Above 7? The ICP isn't clear.
- Interviewers with structured calibration in the last 6 months. Below 80 percent? Panel inconsistency is inflating round counts.
- Mis-hire rate in the last 4 quarters. If you can't answer, that's the audit before the audit.
Bring Metaview into your hiring stack.
Live notes, structured scorecards, and ATS sync, set up in under 10 minutes.
Frequently asked
What is considered a good cost per hire?
There is no universal number. SHRM benchmarks the U.S. average at around $4,700, with technical and executive roles often $10,000 to $20,000. The benchmark that matters more for your team is the trend line: is CPH going down quarter over quarter, with hire quality holding or improving? That tells you whether your operating changes are working.
How often should I calculate cost per hire?
Quarterly is the right cadence for most teams. High-volume hiring teams should track monthly to catch agency drift and channel performance shifts early. The label on the report matters less than the consistency of the snapshot.
Does automating recruiting always reduce cost per hire?
Automation reduces CPH when it removes labor from activities the team was doing anyway (notes, triage, scheduling). It does not reduce CPH if it only adds a new tool license without changing the workflow. Audit which hours the automation reclaims, not which features the tool ships.
What's the difference between cost per hire and cost per applicant?
Cost per hire divides total recruiting spend by hires made. Cost per applicant divides total spend by applications received. Both matter. CPH measures conversion-adjusted cost; CPA measures top-of-funnel cost. If CPH rises while CPA falls, your funnel is leaking somewhere between application and offer.
Can improving candidate experience lower cost per hire?
Yes, materially. Candidate dropouts mid-loop force re-fills, which are pure CPH inflation. A faster, more transparent, more respectful process means first-choice candidates accept more often. Trainline, Brex, and Workleap all rebuilt candidate experience as part of their CPH program.
What is the single highest-leverage change to reduce CPH?
Reclaim recruiter admin hours. Most teams overestimate the impact of channel mix changes and underestimate the impact of removing 12 hours per recruiter per week from scorecard write-ups, manual triage, and debrief coordination. The labor line is bigger than any ad-spend line.