
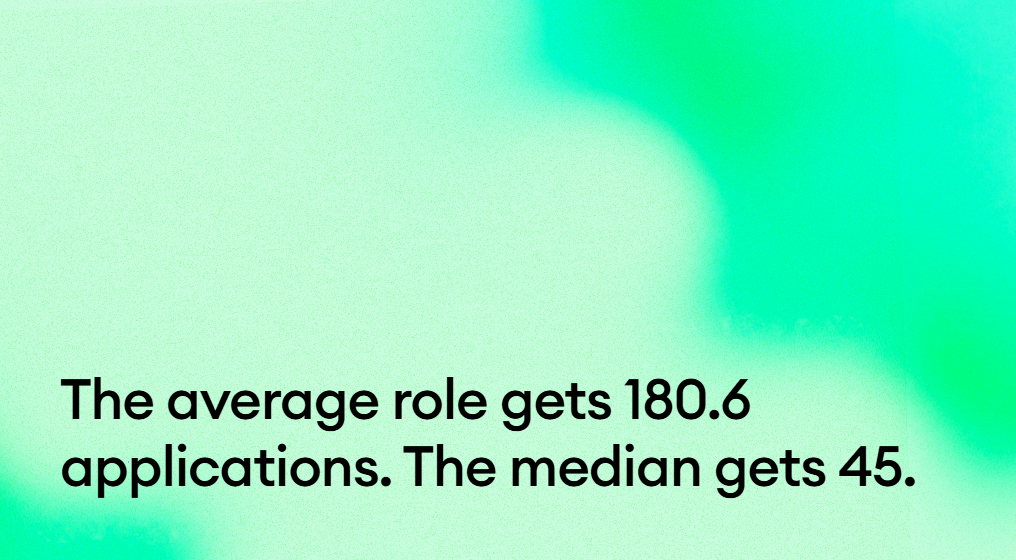
For roles opened in 2026, the average number of applications is 180.6. The median is 45. Same file, same table, and only one of those numbers describes a role anybody is actually working on.
That gap is the argument here. The mean makes you picture every hiring manager buried. The median says something less dramatic and much harder to plan around: most roles are manageable, a minority aren't, and nothing in the data tells you in advance which of yours will be which.
I run the company that sells software for the second kind of role, so read the product section with all the skepticism that fact earns. The volume figures underneath it are third-party, and you can check every one of them yourself.
The average role and the middle role are different roles
The numbers come from aggregated public applicant tracking data covering 128,292,471 applications across 784,361 jobs at 1,612 companies, counted by the year each job opened.¹ It's third-party data and it doesn't measure Metaview's scale. The counting method matters too. A job opened in 2022 has had four years to collect applications. A job opened in 2026 has had months.
The whole file, all years pooled, has a median of 11 applications, a 25th percentile of 2, and a 90th percentile of 249.¹ So a quarter of the roles in there drew two applications or fewer. The top tenth drew 249 or more. Most of that file is small queues with a handful of enormous ones sitting on top.
When a mean sits four times above its own median, the tail is what's setting it. The figure is real and it describes almost nobody. Headlines that quantify the application flood almost always quote the mean, and for anyone working out how to staff a screening week, it's the least useful number in the table.
The middle moved and the top did not
The same file, split by the year each job opened, shows where the change actually happened.
| Year the job opened | Jobs in the file | Mean applications | Median applications |
|---|---|---|---|
| 2022 | 86,411 | 59.5 | 5 |
| 2023 | 82,773 | 119.5 | 9 |
| 2024 | 110,071 | 150.8 | 14 |
| 2025 | 151,115 | 181.2 | 26 |
| 2026, partial | 83,877 | 180.6 | 45 |
The mean and the median in that table tell two different stories. The one everyone quotes is the mean: 59.5 to 180.6 between 2022 and 2026, a rise of 204%.¹ The one nobody quotes is the median, which went from 5 to 45 over the same span. That's nine times over. The middle of the distribution has been growing far faster than the average has.
The last two rows make it sharper. Between roles opened in 2025 and roles opened in 2026 the mean barely moves, 181.2 against 180.6, while the median jumps from 26 to 45. The 2026 cohort is also still filling in: those jobs have had months to collect and the 2025 jobs have had a year or more, so if anything that median move is understated.
The file doesn't say why. AI-assisted applying is the obvious candidate and the years line up, but this data records how many applications each job received and nothing at all about how they were written. The set of companies and roles in the file also shifts from year to year, so some of the movement could be a different mix of employers showing up. I can't test either reading with what's in here.
Gem's co-founder Steve Bartel described the same concentration in customer terms when he came on our podcast.
More than 20% of our customers get thousands of applicants for a single role. Recs per recruiter is up 55%, and time-to-fill is up 8 days.

Those figures are Gem's, and a vendor reading its own customer base is worth discounting. The shape is still the same one. A minority of roles are carrying most of the volume.
Function will not tell you which roles flood
If the flood lands on a minority of roles, the obvious next question is which minority. Everyone looks at job family first. Job family doesn't hold up.
| Function | Median applications per role | Mean applications per role |
|---|---|---|
| Product | 21 | 162.9 |
| Marketing | 15 | 110.2 |
| Engineering | 14 | 170.5 |
| Recruiting and HR | 14 | 152.7 |
| Data | 13 | 151.3 |
| Operations | 12 | 118.6 |
| Sales | 12 | 84.5 |
| Design | 11 | 118.9 |
| Customer success | 11 | 179.8 |
| Finance | 8 | 75.5 |
| All other functions | 8 | 81.9 |
Product has the busiest middle at 21. Finance is the quietest named function at 8. That's a spread of 13 applications between the heaviest job family and the lightest, and nobody reorganizes a team around a gap that small. The second column is where it gets strange. The means for those same families run from 75.5 to 179.8, and customer success carries one of the lowest medians in the file alongside the highest mean in it.
Every function has the same shape: a modest middle and a long tail. Whatever separates a flooded role from a quiet one, this cut of the data can't find it in the job family. If it were in there, the medians would spread the way the means do.
That leaves you somewhere worse than the headline suggests. A minority of your roles will be buried, the middle is rising underneath them, and the most obvious way of working out which ones in advance doesn't work.
A fixed rota is the wrong shape for a skewed queue
Screening capacity in most teams is a rota. So many recruiters, so many hours, split across open roles. That's fixed supply. The distribution above is demand, and at the level of the individual role that demand is neither fixed nor predictable.
Staffing to the average builds for a role that mostly doesn't exist. Most of your roles come in under it and the capacity sits idle. The ones that go over get the same allocation as the ones that never needed it, and that's the point where careful review turns into skimming. It happens on arithmetic alone. Nobody decides to stop reading properly. The queue outruns the hours and something gives.
Three ways out of that, and all three are worth being honest about. You can hire screening capacity for the peak, which almost nobody funds. You can push the peak roles onto keyword filters and accept what those filters do to anyone who described the same work in different words. Or you can change what the first read costs.
What an agent changes, and what it does not
The third one interests me for a narrow reason. Every extra application a recruiter reads costs a slice of their week, and the slice is the same size every time. An agent reads that one more for close to nothing, and it goes on costing close to nothing whether the queue is the size of the median role or the size of the ones piled up at the top of the file. That's the whole structural case, and it's a claim about capacity. It says nothing at all about judgment.
In our case the first read is Application Review. It reads every application against the criteria for the role and sorts candidates into fit buckets, with the reasoning attached to each one, so you can see why a candidate landed where they did and argue with it. The criteria are yours. The agent drafts an ideal candidate profile from the job description and whatever context you add, then you review it, edit it and approve it before a single candidate gets evaluated against it. Candidates sync in from the ATS, and on Ashby, Greenhouse, Lever and SmartRecruiters it pushes the accept and reject decisions back.²
The sales version of this usually skips the next two lines. Metaview never auto-rejects, and the recruiter makes every progress and reject decision, so the number of calls a human has to make stays exactly where it was. What moves is the material those calls get made from. The reading gets cheaper and the deciding stays put.
The agent also has no opinion on whether the criteria you approved were the right criteria. It applies them to every application the same way, which buys you consistency. Correctness is a separate question, and I'm not claiming it.
What this data cannot tell you
Here's where I'd push back if I were reading this instead of writing it.
A cheap first read says nothing about whether the sort is any good. Metaview's product data covers the applications a recruiter actually reached a decision on, and inside that set, 17.2% of great-fit candidates advanced past screening against 5.6% of poor-fit ones.³ That's an association between the rating and the recruiter's decision, and it isn't independent evidence, since the recruiter can see the rating before deciding. Recruiters agreeing with the ordering is not evidence that the ordering was right.
The data also stops at the offer. Nothing in it follows anyone into the job, so there's no version of this argument that ends in a claim about what those people went on to do at work. I don't have that evidence, and neither does anybody else selling you screening software.
The counting has its own problems. Applications are counted against the year the job opened, which approximates annual volume without measuring it directly. The 90th percentile of 249 is pooled across every job and all the years in the file, so it isn't a 2026 figure. And that 25th percentile of 2 is worth sitting with: a good share of this file is roles almost nobody applied to, and they drag the medians down the same way the flooded roles inflate the means.
The sharpest version of the objection came from Dan McCarthy on our podcast, and I still haven't argued my way out of it.
The problems most companies have with recruiting are not 'we have this flood of applications and we need to evaluate people more efficiently.' That is probably not the problem most companies will have in the future as headcount diminishes and the best people have more options.
He's describing the middle of the distribution, and the middle is most companies. If every role you run sits somewhere near the median, your hard problem is still finding people worth talking to, and sorting the ones who turned up is the easy part. Both things are true at once, and a mean of 180.6 against a median of 45 is exactly what that looks like written out.
The flood is real, and the honest claim about it is narrower than the headline. On the minority of roles that get buried, and in a market that adds more of them every year, the first read has to come off the human rota. The arithmetic leaves nowhere else for it to go. Everything after the first read stays exactly where it was.
So if you're working out whether any of this applies to you, go and look at your worst role. Your average one won't tell you much. How many applications did it take, how often does a role like that come around, and what actually happened to the reading when it did? That's the number worth pulling before you buy anything, including from me.
Put an agent on the roles that flood
Application Review sorts your inbound against the criteria you approved and shows the reasoning behind every call, so you can agree with it or overrule it.
Frequently asked
How many applications does a role get in 2026?
In aggregated public ATS data covering 128,292,471 applications across 784,361 jobs, a role opened in 2026 has drawn a mean of 180.6 applications and a median of 45 so far. The gap between those two figures matters more than either one on its own: the mean is pulled up by a minority of very high-volume roles, and 2026 is a partial year still collecting.
Why is the average number of applications per role so much higher than the median?
Because the distribution is skewed. A minority of roles draw very large volumes and pull the mean up, while most roles sit well below it. Pooled across every job and all the years in the same dataset, the median is 11 applications, the 25th percentile is 2, and the 90th percentile is 249.
Which roles get the most applications?
Job family is a weak guide. Across the named functions in the same dataset the median runs from 8 applications per role in finance to 21 in product, a spread of 13, while the means for those same families run from 75.5 to 179.8. Every function shows a modest middle and a long tail, so the flooded roles aren't concentrated in one kind of job.
Does an AI application review agent make the hiring decision?
No. Metaview never auto-rejects. Application Review reads every application against the criteria for the role and sorts candidates into fit buckets with the reasoning attached, and the recruiter makes every progress and reject decision from there.
Does AI screening actually save recruiting time?
It changes where the time goes. Reading one more application costs an agent close to nothing however long the queue already is, so the first pass stops scaling with volume. The decisions don't: since Metaview never auto-rejects, a person still works through the shortlist. The saving lands on the reading, and the deciding costs what it always did.
¹ Application-volume figures come from aggregated public applicant tracking system data covering 128,292,471 applications across 784,361 jobs at 1,612 companies, analyzed by Metaview in 2026. This is third-party ATS data and it doesn't measure how much Metaview itself processes. Means and medians are counted by the year the job opened, which approximates annual volume without measuring it directly, and 2026 is a partial year. The percentile figures are pooled across every job and all the years in the dataset, so they carry no year dimension of their own.
² Supported Application Review integrations and decision writeback per Metaview's Application Review documentation, 2026. Writeback works per integration and isn't universal.
³ Advance rates come from Metaview product data and cover only the applications a recruiter reached a decision on, which is a different base from the volume figures above. The recruiter can see the fit rating when they decide, so the two aren't independent measures.
