
Most TA functions are still measuring the wrong things. Roles opened. Interviews scheduled. Sourced-to-screen conversion. These are activity metrics. They tell you the team is busy. They do not tell you whether the function is producing the outcome the business is paying for, which is a steady supply of people who perform, ramp, and stay.
The fix is not a different dashboard. It is a different operating model. The goals that matter are outcomes, and every outcome has a leading indicator that predicts it. Quality of hire is the lagging metric; structured feedback completeness is the leading one. Offer acceptance is lagging; close-plan rigour is leading. The TA functions running ahead of the curve instrument the leading indicators, then let the lagging outcomes catch up.
This is the playbook. The 12 goals modern TA functions should be running on, grouped by where they create impact (performance, operations, strategy). The leading indicator behind each one, and the surface that watches it. And the operating model that turns the list from a poster into how the function actually runs week to week.
Why the old recruiting goals stop working
The traditional recruiter scorecard is a list of activities the function can count. How many sourcers worked the role. How many interviews got booked. How many candidates moved between stages. The advantage of this scorecard is the numbers are easy to pull. The disadvantage is they have nothing to do with whether the function is producing what the business is paying for.
The way to know the gap is to ask the question Pittman pulls into the section below: of the engineers we hired last year, how many are still here, on the path to promotion, and rated by their manager as a strong contributor? Most TA leaders cannot answer it. Not because the data is uncollectable, but because the function was never set up to track it.
The shift is from lagging metrics (what showed up, after the fact) to leading indicators (what predicts the outcome, in time to influence it). Lagging metrics report on history. Leading indicators are the function's controls. The 12 goals below are arranged so each lagging outcome is paired with the leading indicator a modern TA function actually instruments.
The 12 talent acquisition goals, grouped by impact
The 12 goals fall into three groups. The first four are performance metrics, the kind the CEO asks about in the board pack. The next four are operational, the kind the head of TA owns inside the function. The last four are strategic, the kind that decide whether TA is a service desk or a partner at the leadership table.
Group A. Metric-driven performance goals
1. Improve quality of hire. The 12-month metric that anchors everything. Quality of hire is whether the people you hired are performing, growing, and staying. The leading indicators that predict it are interview rigour (are panelists assessing for the competencies on the scorecard?) and alignment between recruiter, hiring manager, and panel before kickoff. Instrument those and quality of hire trends in the right direction nine months later, without any change to who you source.
2. Increase offer acceptance rates. The single best diagnostic for whether the candidate experience and the close plan are working. Lagging: what % of offers extended got signed. Leading: how complete is the close-plan template at offer-prep (motivations captured, decision criteria captured, blockers flagged), and how aligned the recruiter and hiring manager are on positioning before the offer call. Close-plan rigour predicts acceptance better than comp.
3. Reduce time to productivity (not just time to hire). Time to hire is a candidate-experience metric. Time to productivity is a business metric. Lagging: how long until the new hire is delivering at the level the role demands. Leading: how cleanly the panel captured what excellence looks like during interviews, and how well the hiring manager debrief surfaced ramp blockers before day one. If the panel never wrote down what good looks like, the manager will not know what ramp looks like either.
4. Lower cost per hire (without sacrificing quality). The metric most often misused as a justification for cutting the wrong things. Lagging: total recruiting spend divided by hires made. Leading: panel time per hire (are we running five-round loops when three would do?), recruiter time per hire (are we spending hours rewriting notes or only minutes editing AI-generated ones?). Cost per hire drops cleanly when the leading indicators of process efficiency move.
Group B. Operational excellence goals
5. Shorten hiring cycle times with better processes. Cycle time is rarely about hustle. It is about handoffs. Lagging: days from open to close. Leading: SLA adherence on hiring manager feedback (is it within 24 hours or within 5 days?), scheduling lag between rounds, time from final-round to debrief. Each handoff is an instrumentable leading indicator. The teams that compress cycle time tighten the slow handoffs first, not the candidate-facing minutes.
6. Increase automation across low-value recruiting tasks. Automation is not a goal in itself. It is a leading indicator of where recruiter capacity actually goes. Lagging: hours saved per recruiter per week. Leading: % of interview notes recruiters edit vs write from scratch, % of scheduling cycles that finish without human routing, % of debrief notes that arrive within 24 hours. When those move up, recruiter time gets returned to the part of the job that does not scale: candidate relationships and hiring-manager partnership.
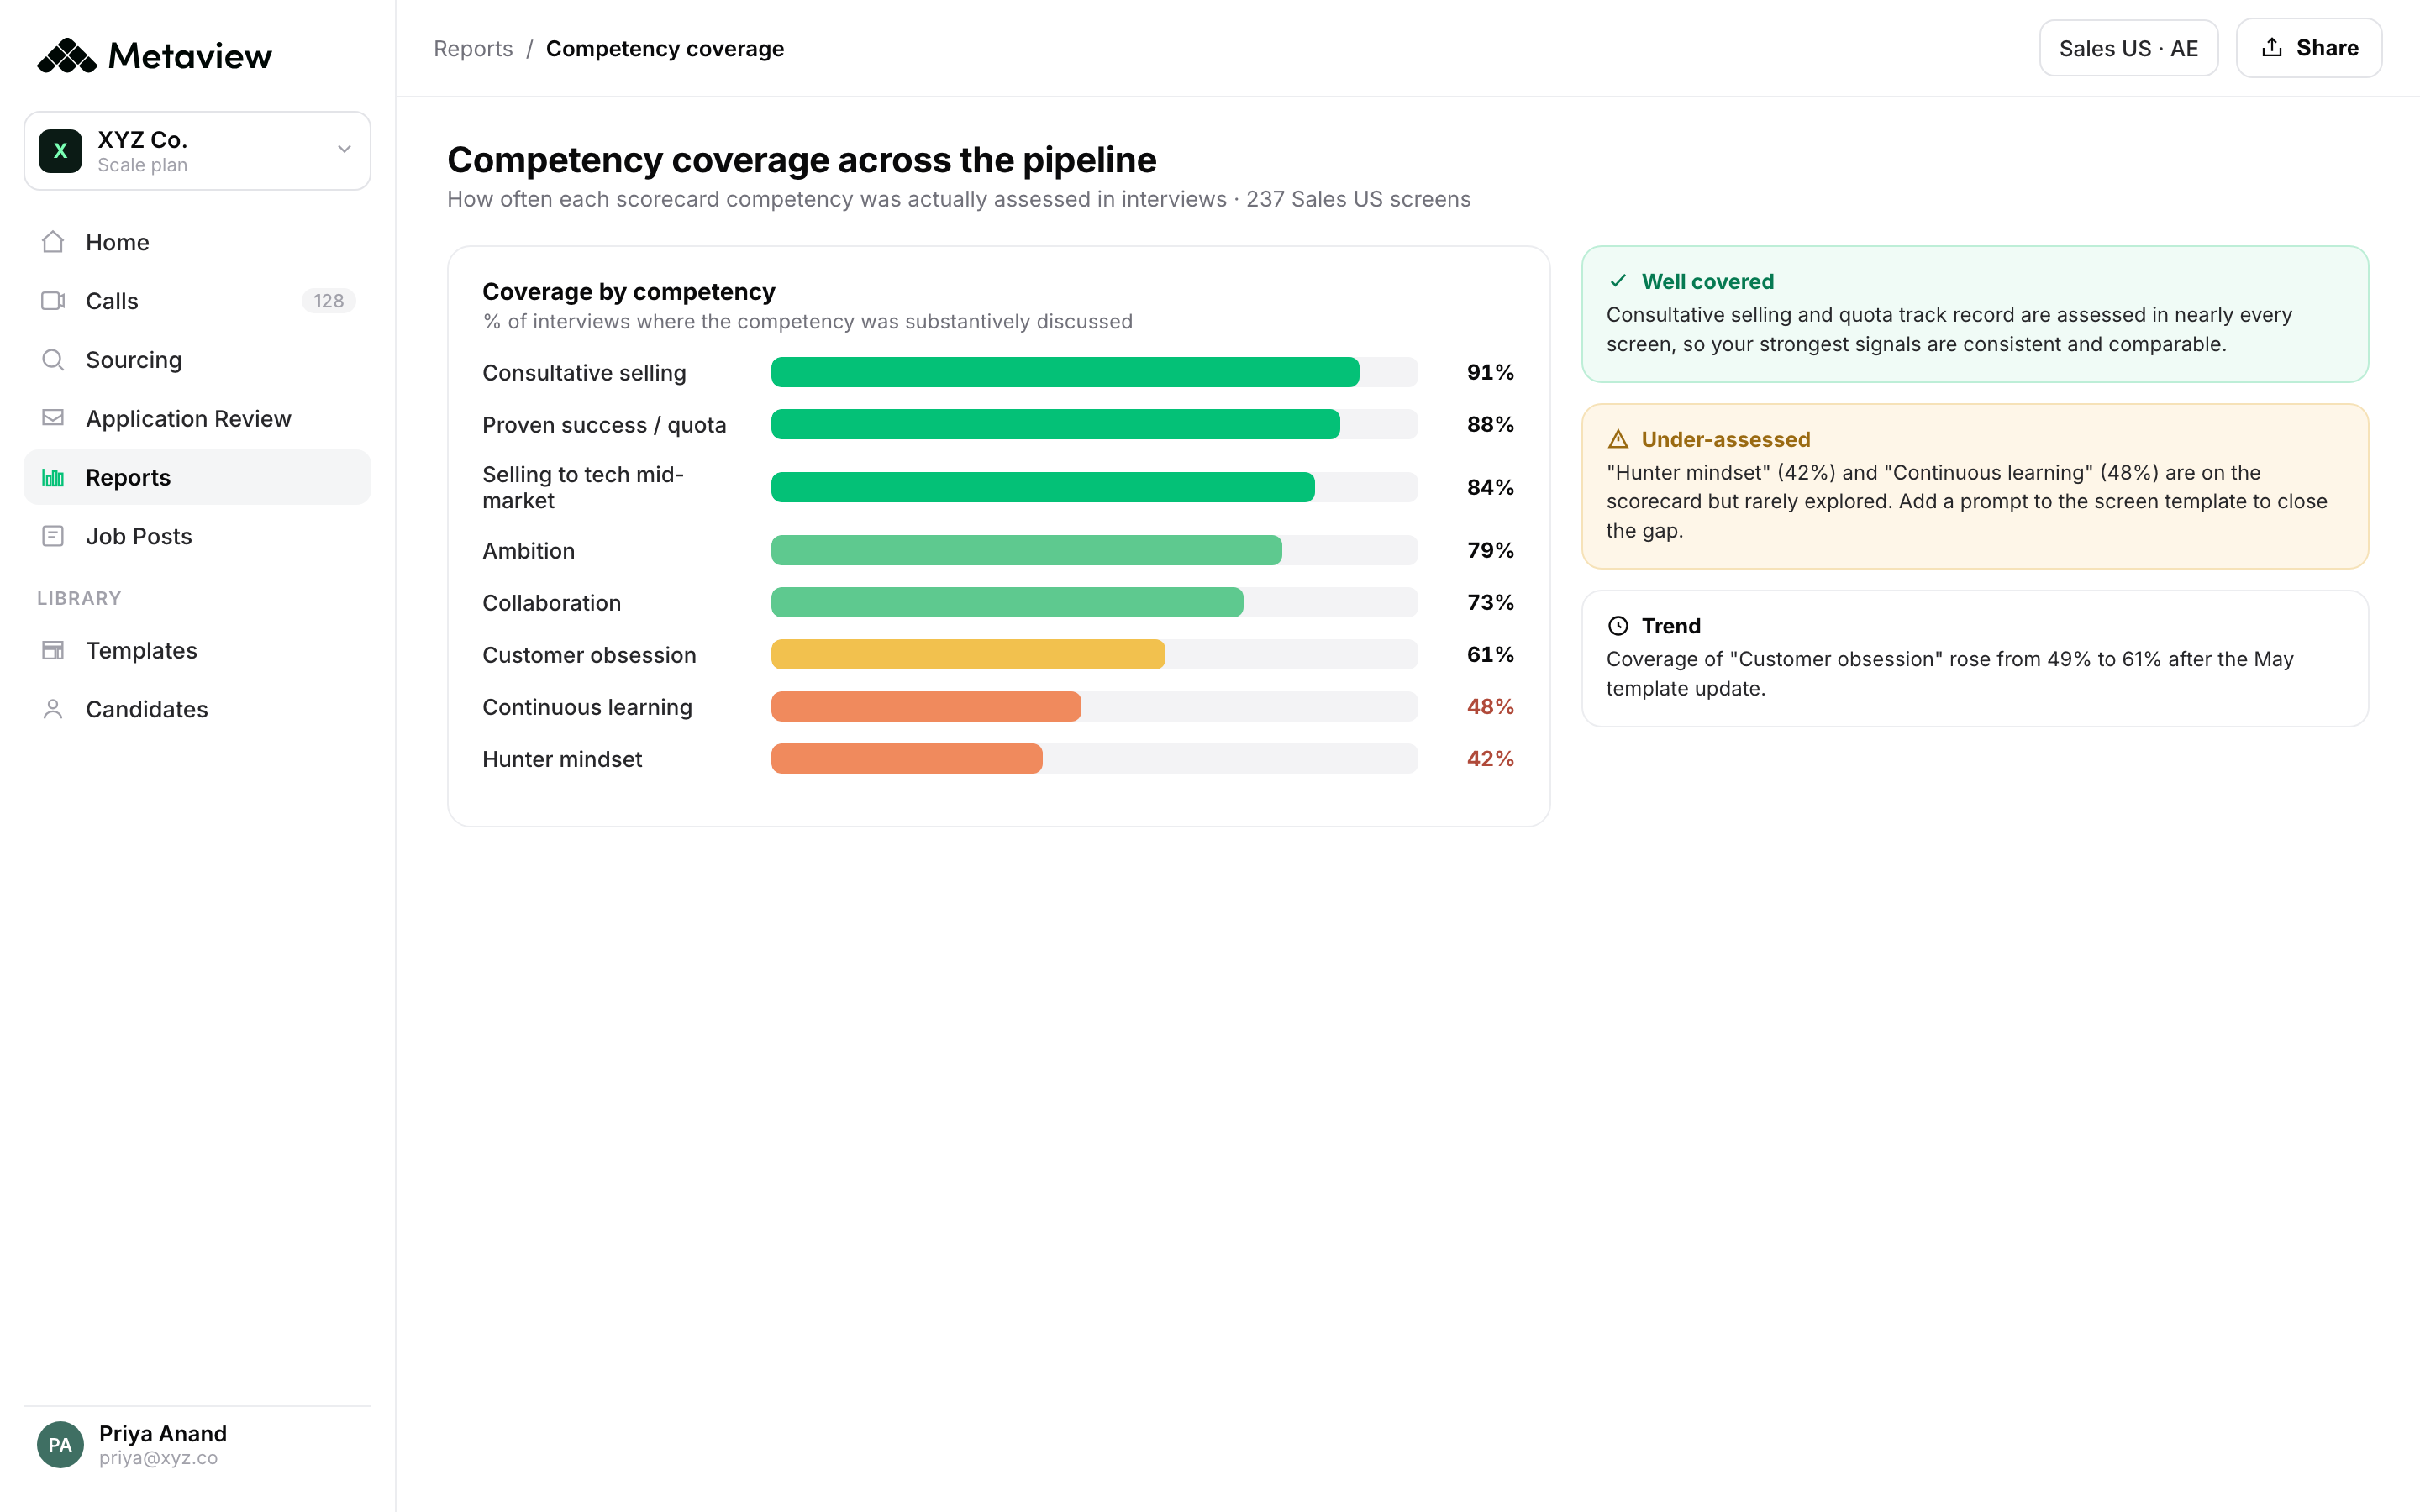
7. Use AI-driven insights to improve interview quality. The interview is where the function makes its most expensive decisions. Lagging: post-hire performance against the predictions the panel made. Leading: scorecard completion rate per panelist, competency coverage per panel (did every required competency get assessed at least twice across the loop?), variance between panelists on the same candidate. Interview quality is now an instrumentable thing, not a vibe.
8. Standardize hiring decisions across teams and roles. The cost of inconsistent decisions is invisible until you go to scale. Lagging: per-team variance in offer rates, hire rates, and 12-month retention. Leading: % of interviews captured against the same competency model, % of debriefs using the same decision framework, calibration score across panelists. Standardisation does not mean homogenous candidates. It means homogenous evaluation rigour, which is the only thing that lets you compare across teams.
Group C. Strategic and organizational impact goals
9. Shift from activity-based to performance-based recruiting metrics. The meta-goal: if the scorecard the function runs on is still counting activities, none of the 11 other goals will land. Lagging: ratio of performance metrics to activity metrics on the TA scorecard. Leading: how often the function's weekly review opens with an outcome question (are we hiring the right people?) versus an activity question (how many roles did we move?). Reframe the weekly, the scorecard follows.
10. Strengthen recruiter and hiring manager partnerships. The cross-functional relationship that quietly determines whether the function works at all. Lagging: hiring manager NPS, time-to-fill by partnership maturity, retention by hiring manager. Leading: kickoff completion rate (did the recruiter and HM align on competencies before sourcing started?), debrief participation rate, mid-loop check-in cadence. Partnership quality is the indicator the alignment report makes very clear predicts whether teams hit business goals at all.
11. Improve candidate experience as a measurable outcome. Candidate experience used to be a survey at the end. Now it is a series of leading indicators across the loop. Lagging: post-process candidate NPS, offer acceptance by candidate-experience cohort. Leading: median response time to candidate questions, % of candidates with a scheduled close-out conversation regardless of outcome, % of feedback delivered to candidates within 5 business days. CX is now an operational metric, not a brand one.
12. Demonstrate recruiting's impact on business outcomes. The hardest goal and the most important. Lagging: hires placed in roles that hit their first-year business plan. Leading: % of hires that map back to a documented strategic priority from the kickoff, % of roles closed against the original spec rather than a re-spec, % of hires the hiring manager rates as high-performing at the 6-month mark. The function that can name the business outcomes its hires drove gets the seat at the leadership table. The one that cannot, does not.
Talent acquisition needs to think about not the quantity of hires, but the quality. Are these people actually thriving in the organization? I don't care if you hired 500 engineers, how many of those were still employed after 12 months? How many made it to six weeks? Nobody can answer that.”
The leading indicators that predict each goal
The pattern across the 12 is the same. Each goal has a lagging metric the business reports on, and a leading indicator the function can actually move week to week. The table below collapses the pattern down to the eight most-instrumentable goals.
| Goal | Lagging metric today | Leading indicator (and Metaview surface) |
|---|---|---|
| Quality of hire | 12-month retention + performance review | Interview rigour: % of competencies assessed at least twice in the loop (Reports) |
| Offer acceptance | % of offers signed | Close-plan completeness at offer-prep (Multi-Source Summaries) |
| Time to productivity | Weeks to performing at level | % of panels that captured what good looks like verbatim (AI Notes) |
| Cycle time | Days from open to close | Hiring manager feedback SLA adherence (Reports) |
| Interview quality | Post-hire performance vs prediction | Scorecard completion rate per panelist (Reports) |
| Standardised decisions | Cross-team variance in offer and hire rates | % of interviews captured against the same competency model (AI Notes) |
| Recruiter-HM partnership | HM NPS + time-to-fill by partnership maturity | Kickoff completion rate before sourcing (AI Notes + AI Filters) |
| Candidate experience | Post-process candidate NPS | Median response time + % candidates closed out properly (Multi-Source Summaries) |
The instrumentable column is what changes the operating cadence. A TA function reviewing leading indicators in its weekly knows where to intervene before the lagging metric reports the damage. A TA function reviewing only lagging metrics is doing forensics.
According to Metaview's 2026 AI & Hiring Alignment Report, surveying 505 recruiting leaders and hiring managers across North America and EMEA, teams without excellent cross-functional partnerships are 3x more likely to miss their business goals. The leading indicators in the table above are exactly what those teams are not instrumenting. Strong partnerships also lift initial-search alignment, and the share of teams that rate the cross-functional relationship as excellent climbs to 55% when AI sits at the core of hiring rather than the periphery.
The operating system: from goal to OKR to leading indicator
A list of 12 goals is not an operating model. The functions that make goals real run them through the same five-step loop, every quarter. The point of the loop is not the OKRs themselves; it is the cadence that keeps everyone working off the same picture of what the function is trying to do.
1. Pick three (not twelve)
The trap is treating the 12 as a checklist. They are not. They are a portfolio. A TA function focusing on all 12 is focusing on none. Pick the three that matter most for the business this quarter (or this half), and explicitly de-prioritize the others. Quality of hire and recruiter-HM partnership are almost always two of the three. The third varies by stage: cycle time for high-growth, candidate experience for premium brand, offer acceptance for senior IC searches.
2. Translate each into a quarterly OKR a recruiter can influence
An OKR is only useful if a recruiter can do something differently on Monday because of it. Improve quality of hire is not an OKR. Raise scorecard completion rate across the senior engineering panel from 60% to 90% by Q-end, measured weekly, is. Influence is the test: if no one's day-to-day behavior would change, the OKR is decoration.
3. Name the leading indicator and the surface that watches it
Every OKR needs a leading indicator and a place where someone watches it. Watched by the head of TA in the Friday review is a real owner. Tracked in a Notion page is not. The surface determines the cadence; the cadence determines the behavior.
4. Align the cadence with the hiring manager
The weekly TA review is half the loop. The other half is the cadence with the hiring manager. Bring the same leading indicator into the kickoff, the mid-loop check-in, and the debrief. The HM should be reading the same dashboard as the recruiter. When they see the same numbers, the conversation stops being about who is to blame and starts being about what to change.
5. Re-pick at quarter-end
The portfolio is not static. Some goals will land; some will not. Some will become less relevant as the business changes. At quarter-end, ask: which OKR moved its leading indicator? Which did not, and why? What does the business need next quarter that we are not currently instrumenting? Then pick the next three.
The product layer that surfaces the indicators
Most of what makes the operating model run is a capture-and-routing problem, not a strategy problem. The leading indicators above (scorecard completion, kickoff alignment, feedback SLA adherence, panel variance, close-plan completeness) all share a structural property: they are byproducts of interviews if you instrument the interview correctly, and they are invisible if you do not.
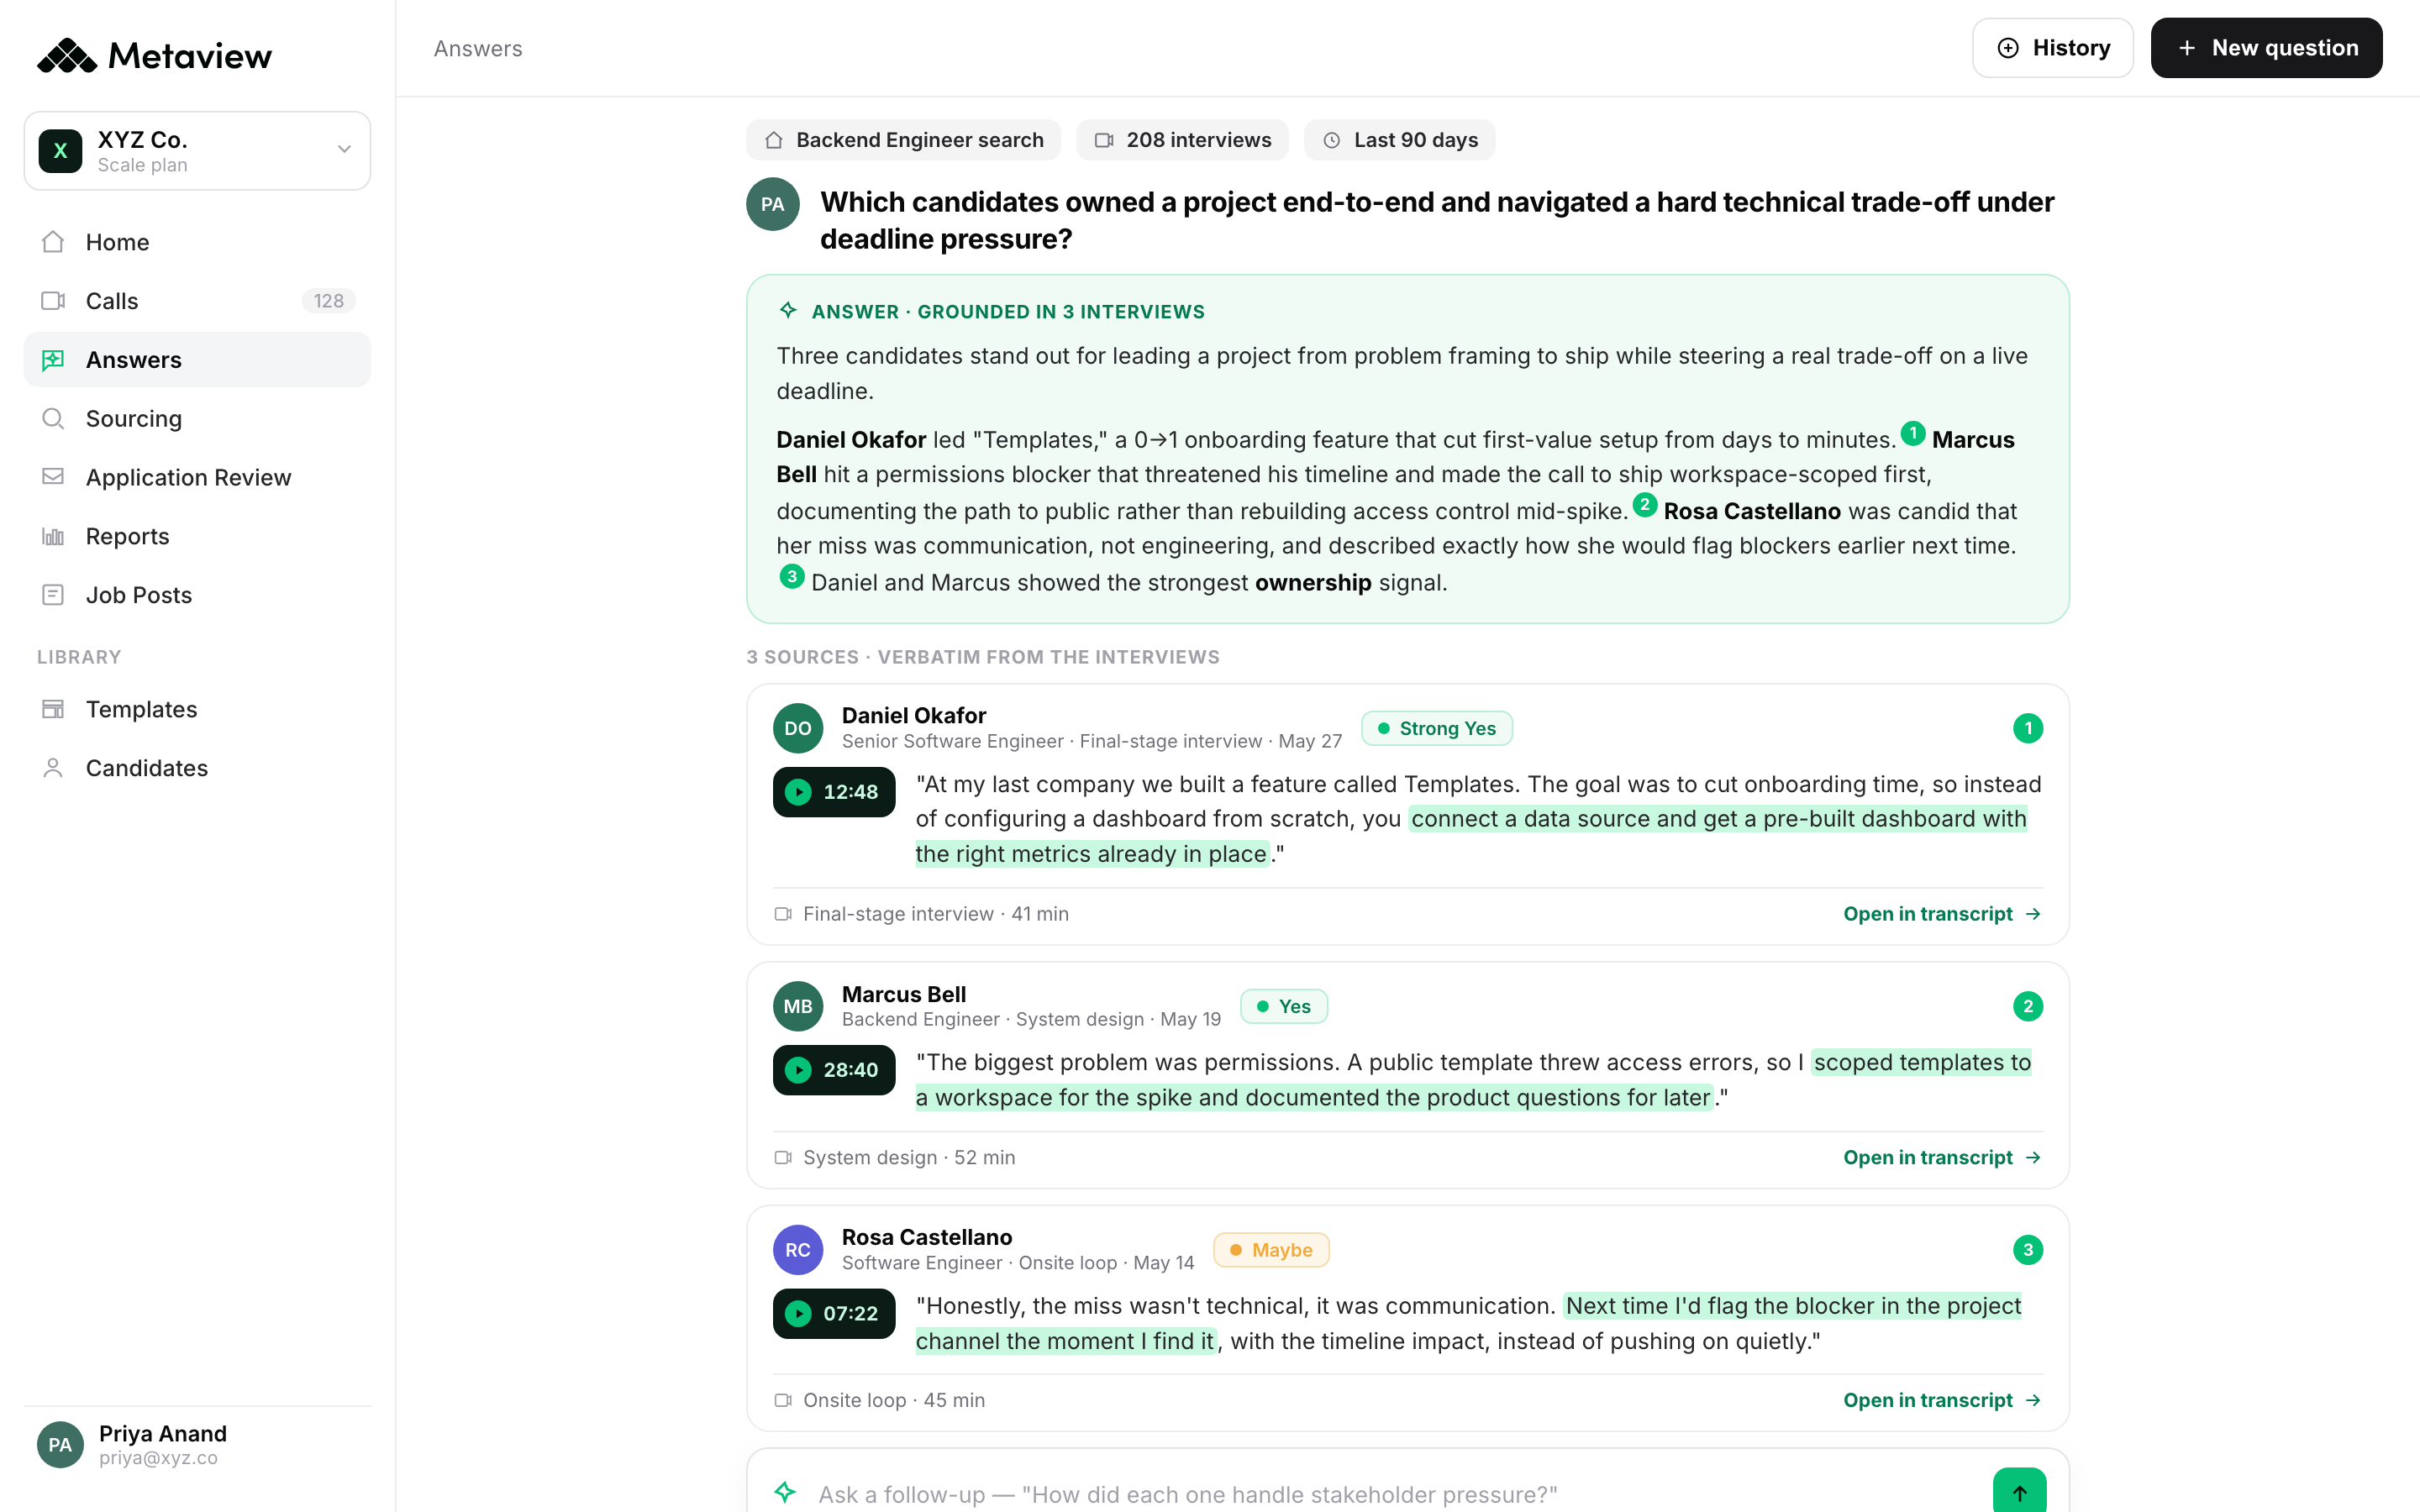
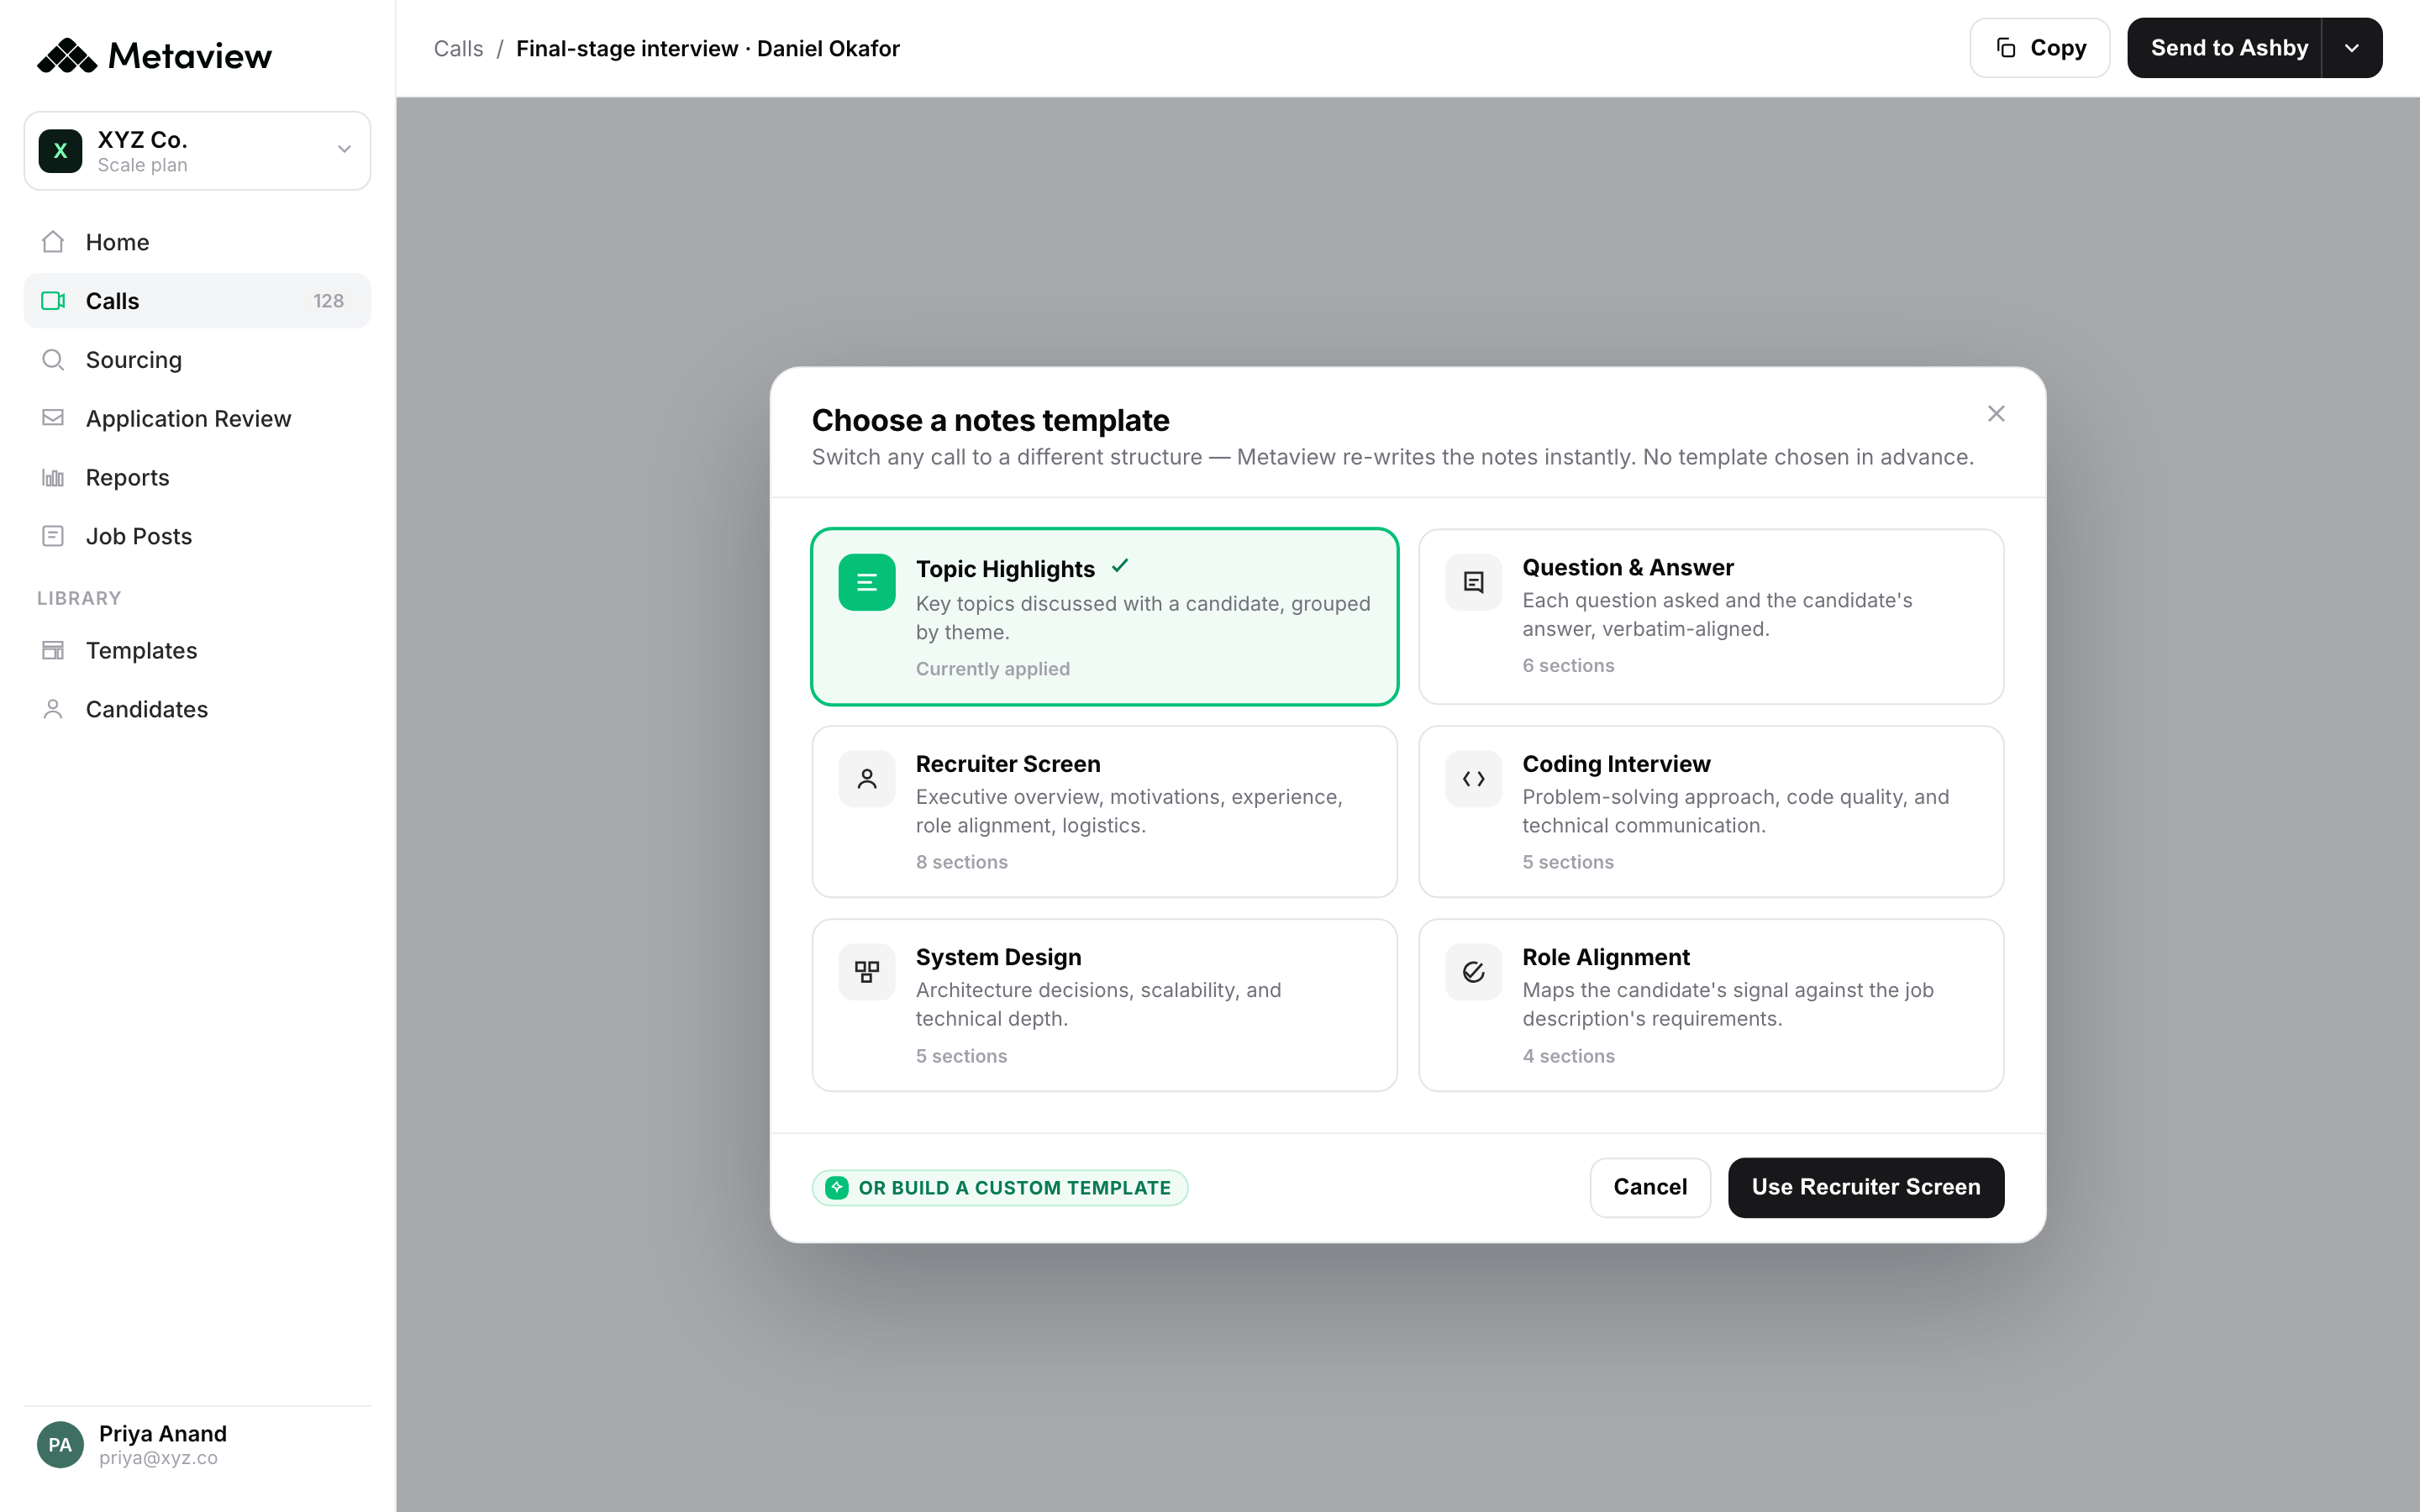
AI Notes captures every interview against the scorecard automatically, so scorecard completion rate becomes a metric instead of a hope. AI Filters lets the head of TA query across every interview, for example did engineering panels assess for system design twice on senior roles last quarter, and get a citation-backed answer instead of pulling people into a meeting. Multi-Source Summaries rolls up panel signal into a single per-candidate view, which is what makes the close-plan completeness check possible. Reports is where the eight leading indicators in the table above actually live, surfaced as movable numbers instead of forensic ones.
The intent of the product layer is not to replace the function. It is to give the head of TA a Friday review that takes 30 minutes and gives them the controls. Without that, the operating model collapses back into status updates.
- 1Scorecard completion rate per panelist, the leading indicator behind interview quality.
- 2Competency coverage per loop, the leading indicator behind quality of hire and standardisation.
- 3Feedback SLA adherence, the leading indicator behind cycle time and candidate experience.

Sources candidates against the same competency model the scorecard, interviews, and indicators all use. Same vocabulary top of funnel as bottom.

Triages inbound against the scorecard the panel will reference. The leading-indicator chain starts at the first touchpoint, not the first interview.

Captures interviews verbatim against the scorecard. Without this layer, scorecard completion rate and competency coverage are uncountable.

The Friday review surface. Where the eight leading indicators in the table above are visible as movable numbers rather than monthly retrospectives.
What customer TA functions running this play are operating
The pattern across the customer base that runs this operating model: they treat the TA scorecard like a product team treats a metrics dashboard. The leading indicators are the controls; the lagging outcomes are the validation. Weekly cadence on the leading indicators, quarterly cadence on the lagging. Everything below the surface is the same capture-and-routing infrastructure: interviews captured against a shared model, signal routed to the people who need it, partnership data visible to both sides of the loop.
What changes for the function when this lands is not the volume of work but the kind of conversation TA gets to have. It stops being about whether interviews were scheduled and starts being about whether the people being interviewed are the right ones, evaluated rigorously, and closing at the rate the business needs. That is the conversation that earns the function a seat at the leadership table.
When recruiting partners come to the table with data and insights rather than just candidates, the entire hiring process transforms.”
Redefining success for the modern TA function
The shift this article is pointing at is not a list of goals. It is a change in what TA is for. A function that measures itself on activity is a service desk: requests come in, candidates go out, the scorecard counts the throughput. A function that measures itself on outcomes is a partner at the leadership table: the scorecard counts whether the people hired are doing what the business hired them to do, and the function gets called into the strategic conversations because it can answer that question.
The 12 goals above are how to get from one to the other. The leading indicators are the controls. The operating model is the cadence. The product layer is the instrumentation. None of it is novel in any single piece. What is novel is treating it as a system, and running the function on it week after week.
Bring Metaview into your hiring stack.
Live notes, structured scorecards, and ATS sync, set up in under 10 minutes.
Frequently asked
What are talent acquisition goals?
Talent acquisition goals are the outcomes a TA function is trying to produce for the business: people who perform in their roles, ramp quickly, stay, and signal a brand candidates want to work for. The goals worth running on are outcomes, not activities. "Increase quality of hire" is a TA goal. "Schedule 200 interviews this quarter" is a workload metric pretending to be one.
How are recruitment goals different from recruiting KPIs?
A goal is what the function is trying to produce. A KPI is one of the numbers used to measure progress against it. Most TA scorecards mix them up: they list KPIs (interviews booked, candidates sourced) and call them goals. The fix is to write the goal as an outcome, then pick the leading indicator that predicts the outcome, then track the indicator weekly.
What are the most important performance goals for recruiters?
Quality of hire, offer acceptance rate, recruiter-hiring manager partnership quality, and the ability to demonstrate impact on business outcomes. These four sit across all three groups in the playbook and consistently differentiate functions that hit their numbers from functions that get reorganized. The other eight goals matter, but a function landing these four is a function the leadership team trusts.
How can recruiters influence metrics they don't fully control?
By instrumenting the leading indicators. Recruiters do not directly control quality of hire; they do control how rigorously the panel assesses competencies, how completely scorecards get filled in, and how aligned the kickoff is. Those are the leading indicators that predict the outcome. The point of the operating model in this playbook is exactly that: the function does not have direct authority over the outcomes, but it has full authority over the indicators that predict them.
How does AI help recruiters achieve talent acquisition goals?
AI shifts the work from capturing what happened to acting on what is about to happen. Interview notes that wrote themselves free recruiter time for relationship work. A search across every interview surfaces patterns in seconds instead of meetings. Cross-panel summaries make the offer-prep view possible. The point is not that AI replaces the recruiter's judgment; it is that AI replaces the recruiter's typing, so judgment can be where the function spends its time.
How many goals should a TA function run at once?
Three. More than three at full attention is rarely sustainable; fewer than three leaves obvious gaps. The right three vary by stage, but quality of hire and recruiter-HM partnership are almost always two of them, with the third picked from the operational or strategic group based on the business's current bottleneck. Re-pick at quarter-end.