
Look at any ATS export and the interview-to-hire ratio (ITHR) sits there in one cell. Total interviews divided by total hires. 6 to 1. 9 to 1. 12 to 1. Whatever the number is, it gets emailed to leadership every quarter and treated like a verdict on the recruiting function. The trouble is that ITHR is the last number in a long chain of decisions, not the first. By the time it lands, every lever that could have moved it has already been pulled.
According to Metaview's 2026 AI & Hiring Alignment Report - surveying 505 recruiting leaders and hiring managers across North America and EMEA, fielded with Cint - 67% of teams lose qualified candidates to faster-moving competitors every month, and 85% of companies exceeding their hiring goals have AI core to how they hire. Both numbers point in the same direction. The teams hitting their ITHR target are not the ones tightening the screw on the final stage. They are the ones reading the three upstream ratios that produce it, together, as one stack.
This guide is the operator's view of that stack. What ITHR actually measures (and what it misses). The three upstream ratios that move it (intake calibration, screen signal, panel decision). How each ratio leaks, and the signal to spot the leak before it becomes a bad quarter. The four-week diagnostic plan. And the place Metaview sits inside it, as the layer that turns each interview into structured signal rather than an opinion in someone's notes.
Why ITHR alone tells you almost nothing
ITHR has one job: tell you how many candidate interviews your team had to run to land one accepted offer. It is mechanically simple to calculate. Pull total interviews for a role, divide by total hires for the same role over the same period. Done. The trouble is the answer to that division has roughly zero diagnostic value on its own. A 6 to 1 ratio can mean exceptional intake calibration and tight panels (good), or weak screens compensating for vibes-based onsite decisions (bad). The ATS export shows the same digits either way.
The other reason ITHR misleads is that the obvious way to tighten it makes the underlying problem worse. Cut a panel round? ITHR drops, signal drops, regretted-hire risk goes up. Auto-advance more candidates? ITHR drops, screen-to-onsite ratio collapses, recruiter time burns at the next stage. Push hiring managers to decide faster? ITHR drops, debrief discipline evaporates, offer-acceptance rate drops. Every direct intervention on the final ratio swaps the metric you can see for one or two you cannot, and the function feels worse a quarter later.
The fix is not a better way to compute ITHR. It is to stop treating it as a target and start treating it as a receipt. The receipt comes from three upstream ratios you can actually move. Read them together and the cause of a bad ITHR is usually obvious inside 10 minutes. Read ITHR alone and you will spend the quarter tweaking the wrong stage.
The three upstream ratios actually moving it
The hiring funnel produces ITHR through four stages. Intake (the role gets defined and approved). Screen (recruiter assesses whether the candidate clears the bar). Onsite (panel interviews stress-test the candidate against the scorecard). Offer (a decision gets made, the offer goes out, the candidate accepts or declines). The cumulative ITHR is the product of three pass rates: intake-to-screen, screen-to-onsite, and onsite-to-offer. Move one upstream pass rate and every downstream number moves with it.
The fastest way to feel the leverage: if the screen-to-onsite pass rate goes from 30% to 50%, ITHR drops 40% without a single change to the panel format. If panel debrief discipline lifts onsite-to-offer from 40% to 55%, the cumulative ITHR drops again with no change at the top of the funnel. Both moves require capturing structured signal at the stage you want to fix, and feeding that signal back to the people making the call at the next stage. That is the whole operating principle behind a working ratio stack.
Ratio 1: intake-to-screen
What it measures: the share of sourced or applied candidates that recruiters move into a real screen call. A healthy intake-to-screen pass rate sits in the 8% to 15% band for most knowledge-work roles, higher for specialist or referral-heavy pipelines. The signal it carries is intake quality. If recruiters and hiring managers walked out of the kickoff meeting aligned on what good looks like, the recruiter screens the right people and pass rates land in the band. If the kickoff drifted, recruiters either over-screen (too few clear the bar) or under-screen (too many do, and the cost gets paid at onsite). Either tail is a kickoff problem, not a screening problem.
Ratio 2: screen-to-onsite
What it measures: the share of screened candidates that move into onsite panels. The healthy band sits between 25% and 50%, depending on role seniority and pipeline source. Below the band, either the screen is over-rejecting on noise (the recruiter is missing real signal) or the screen template is asking the wrong questions. Above the band, the screen is rubber-stamping candidates that should have been disqualified, and onsite panels pay the tax. The signal this ratio carries is screen consistency. If five recruiters screen for the same role and their individual pass rates spread by more than 15 percentage points, the screen is not a screen, it is five different conversations.
Ratio 3: onsite-to-offer
What it measures: the share of onsite candidates that get a real offer (offer extended, not verbal interest). Healthy band: 20% to 35% for individual contributor roles, lower for senior roles. Below the band, panels are over-rejecting. Usually a calibration issue, sometimes a scorecard issue. Above the band, panels are under-rejecting and the team is making offers it regrets. The signal this ratio carries is panel decision discipline. The most common pathology is panels that vote on a candidate they all liked but for different (and contradictory) reasons. Without structured signal from each interview, the debrief becomes a vibe meeting, and the ratio drifts in whichever direction the loudest panelist points.
How each ratio leaks, and the signal to spot it
Each upstream ratio has a characteristic leak pattern. Spot the leak in the ratio and you know what to fix without running a separate process audit. The four most common leaks across every recruiting function I have worked with are below, mapped to where they hide in the data and what fixes them. The pattern that ties them together: each leak persists because the team has no shared record of what actually happened in the interview. Adding the record dissolves the leak.
Recruiter and hiring manager nod through kickoff, then screen against different bars for the next six weeks. Spot it in: intake-to-screen pass rate above 18% or below 6%. Fix: capture the kickoff itself, surface the must-haves and nice-to-haves as a structured intake summary the recruiter screens against.
Same job description, five different recruiters, five materially different conversations. Spot it in: screen-to-onsite pass rates that spread by more than 15 points across recruiters on the same role. Fix: same structured scorecard template, populated by AI Notes from the actual screen, reviewed before any forward decision.
Panel agrees the candidate is "strong" but cannot recall which competency each interviewer covered. Spot it in: onsite-to-offer rates that move 20+ points based on which panel rotation a candidate drew. Fix: structured panel scorecards tied to specific competencies, cross-panel summary at debrief that surfaces gaps in coverage.
Offer extended on Tuesday, conflicting panel feedback surfaces Friday, retraction is impossible. Spot it in: offer-acceptance rates above 90% (panels are saying yes to everyone) or below 60% (rushed offers, candidate sees it). Fix: cross-panel AI summary auto-generated before debrief, no offer extended until the summary is read.
Two of the four leak patterns above explain the majority of inflated ITHRs I see in audits. Intake silent disagreement creates a chain reaction that compounds at every downstream stage. Vibes-based debrief invisibly recycles candidates through repeat panels because nobody can remember exactly what was decided last time. Fixing either one usually pulls 1 to 2 interviews per hire out of the system inside a single quarter, with no change to the funnel design.
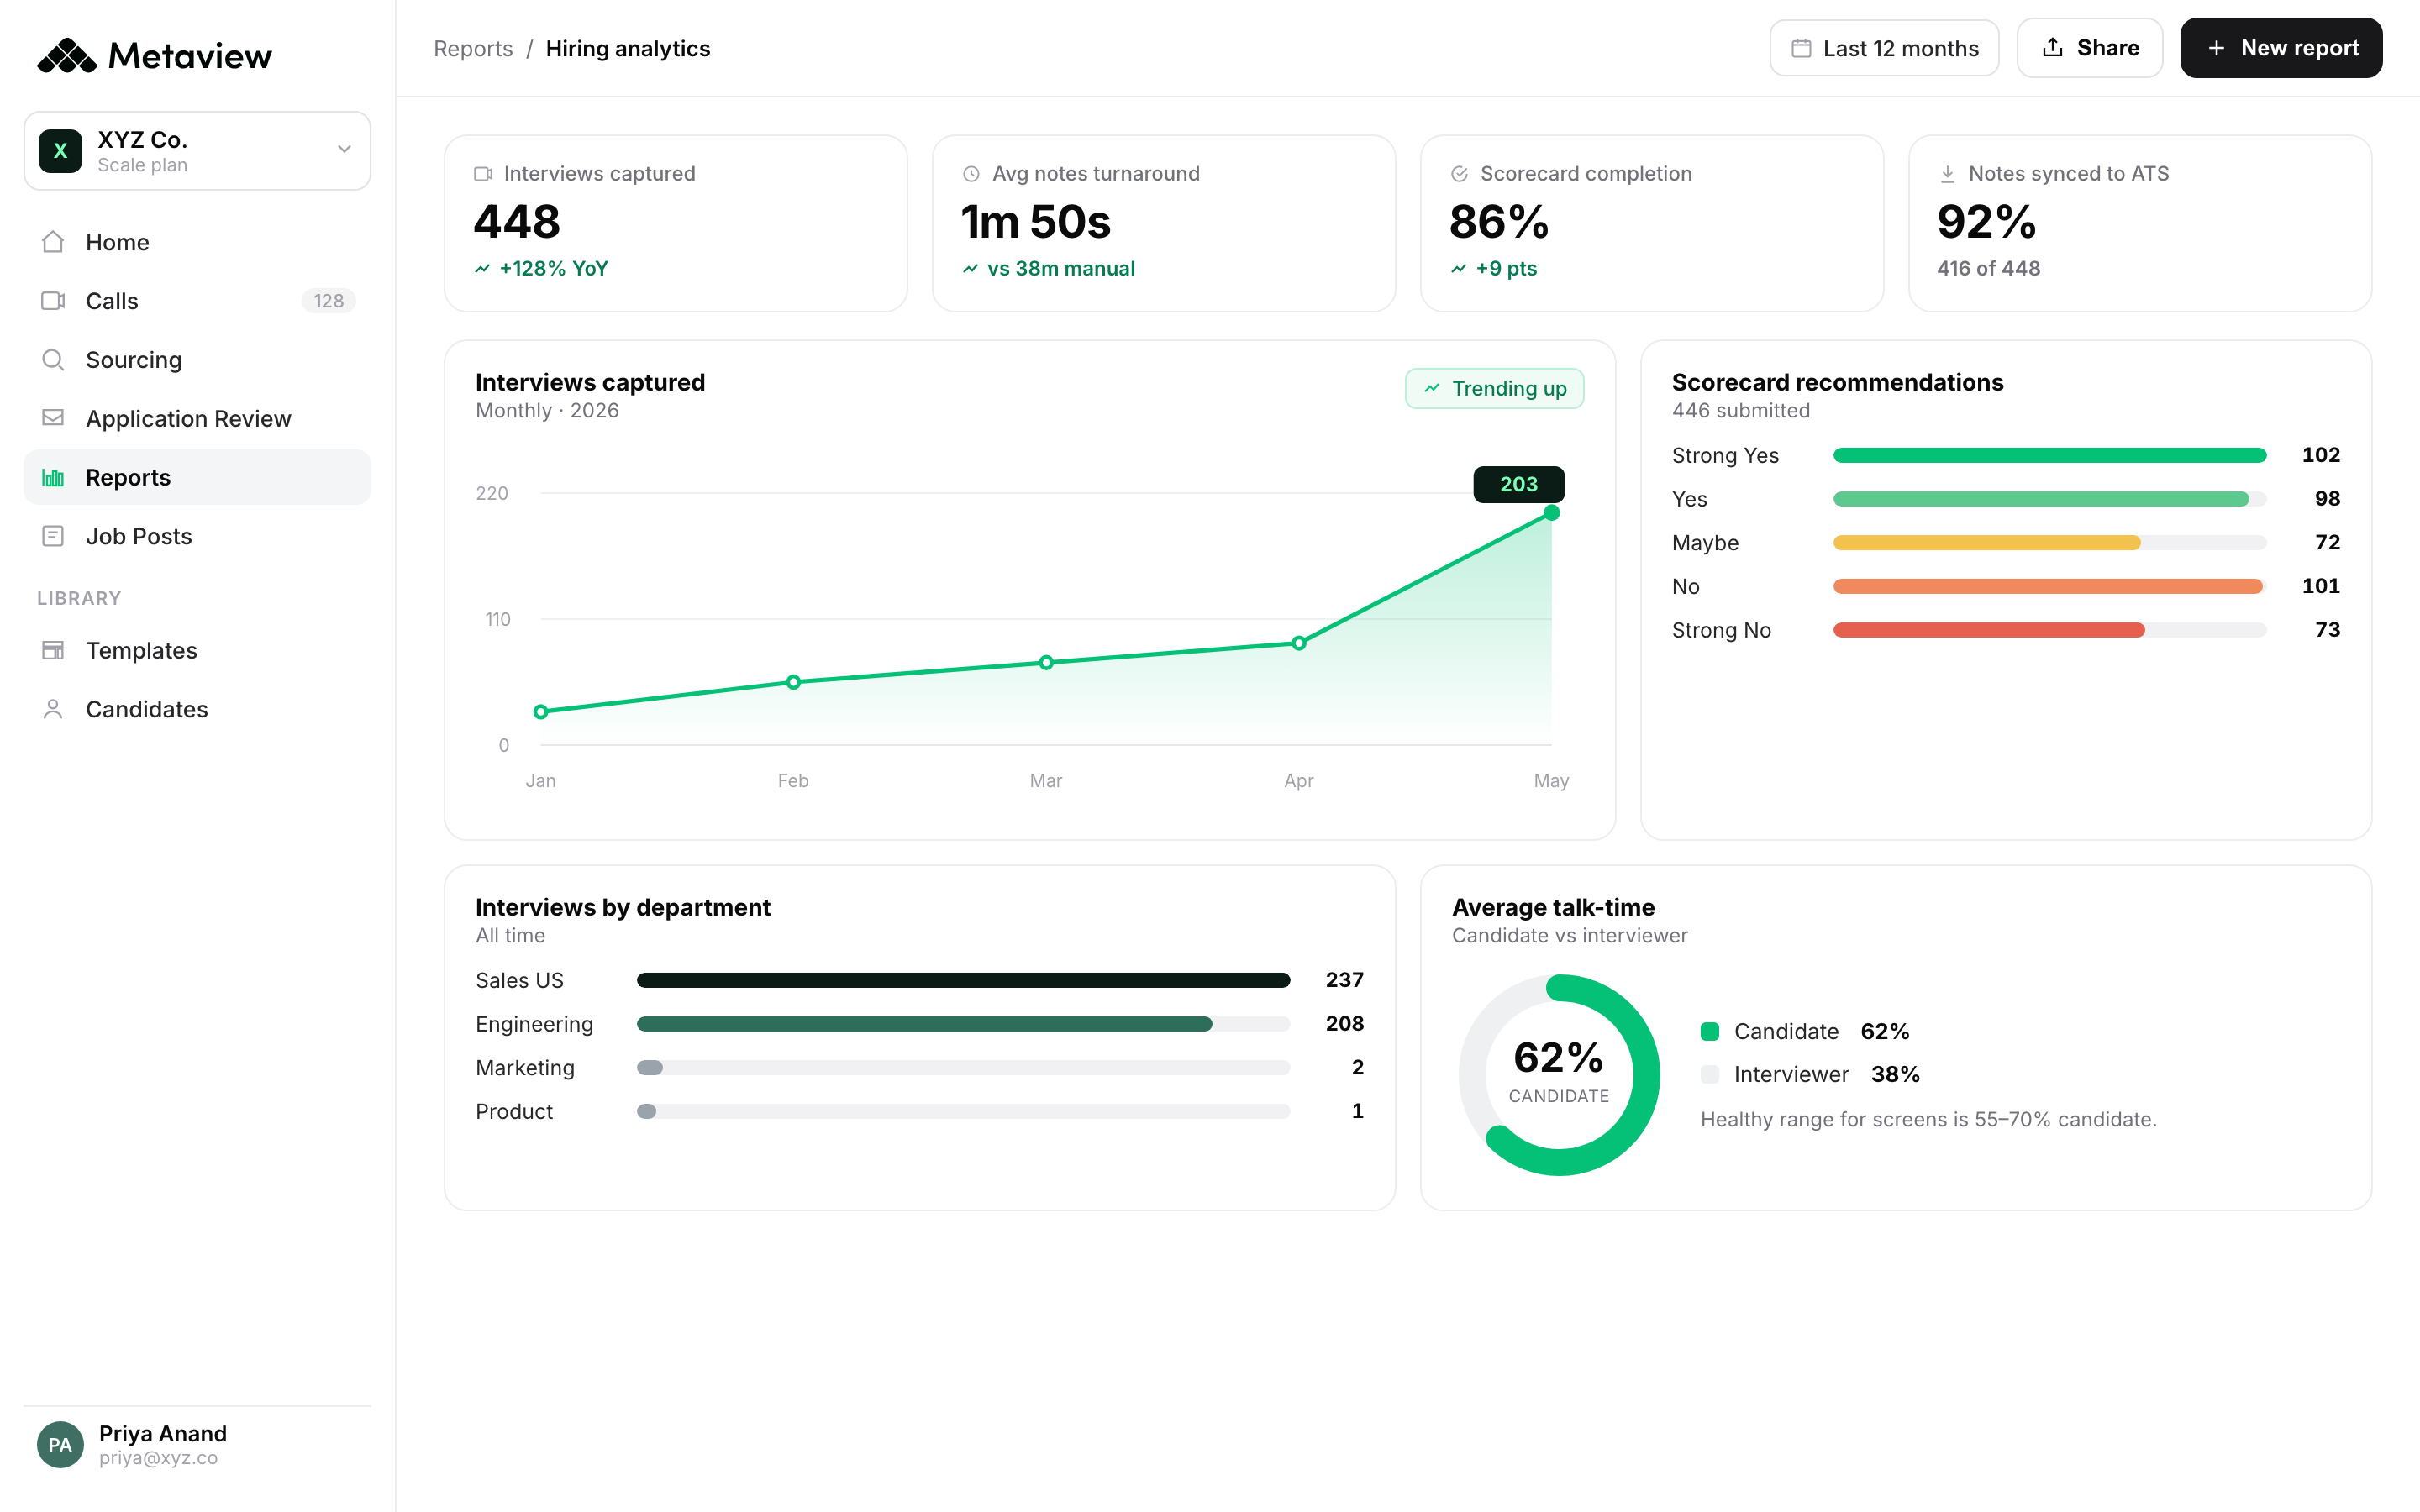
Reading the ratio stack on a real dashboard
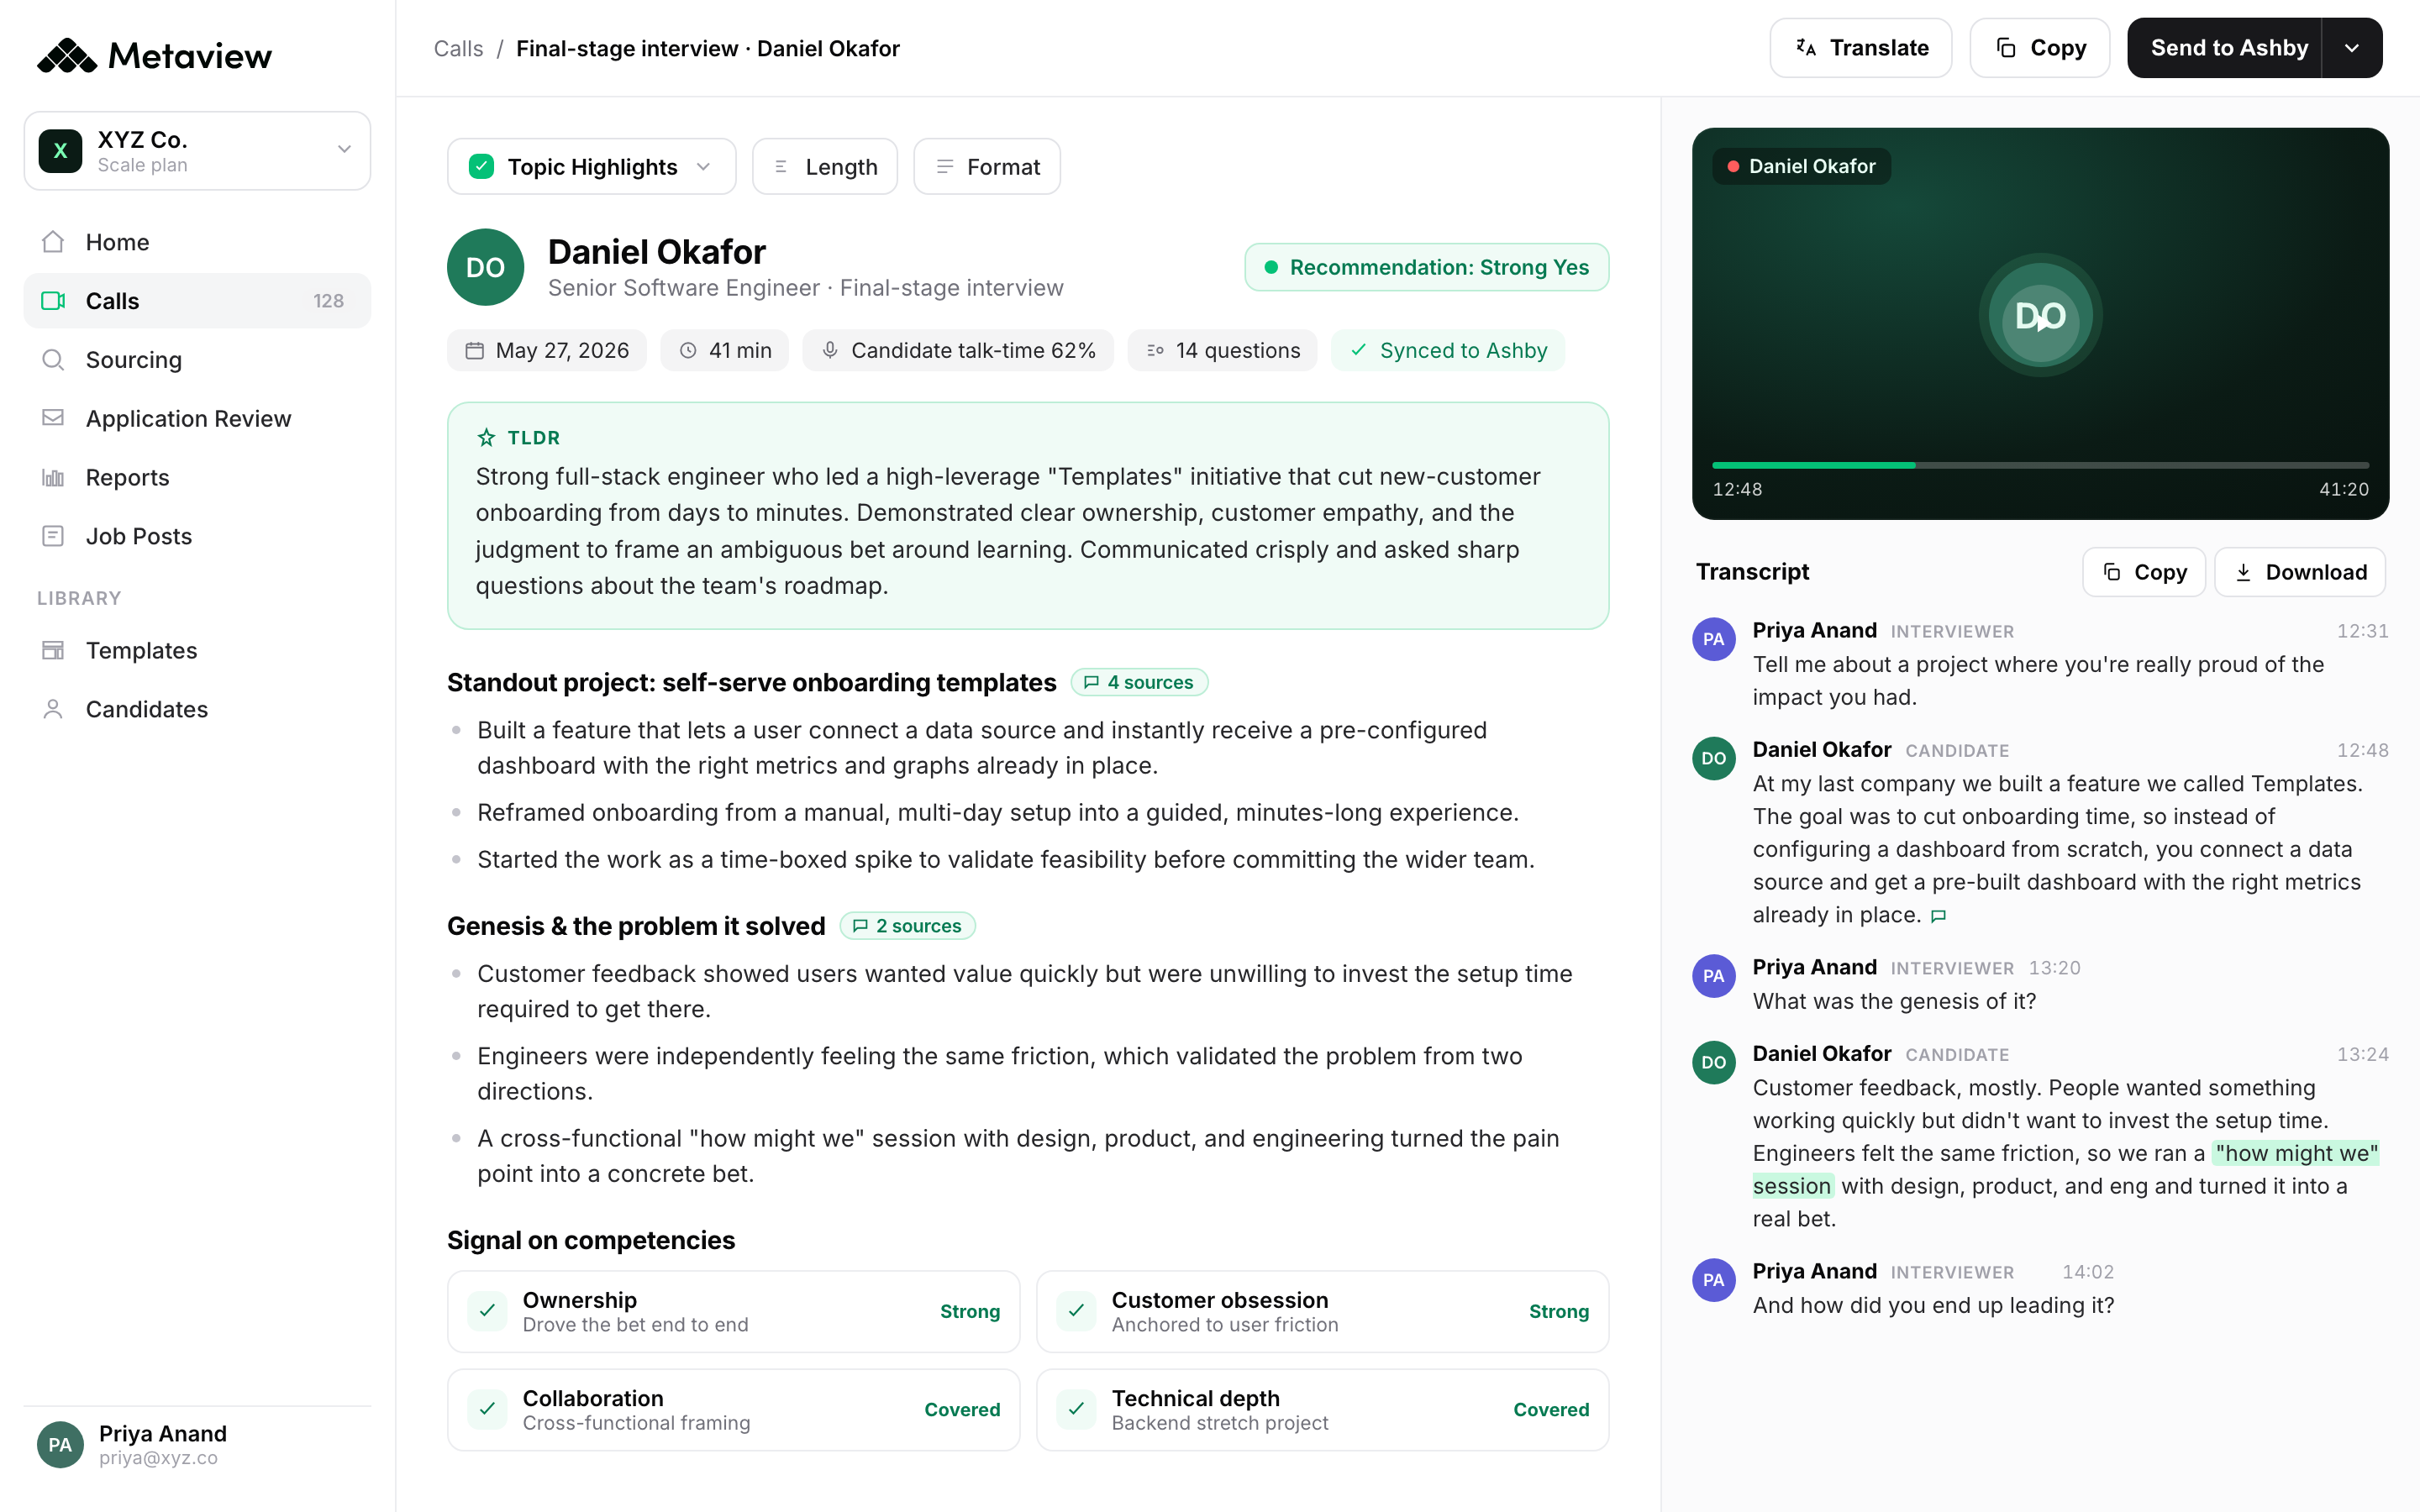
When the three upstream ratios are visible alongside each other, ITHR explains itself. The Metaview reports view is where most operators read the stack today. Each interview gets captured, the structured outputs get aggregated, and the ratios are exposed at the stage they describe rather than buried in an ATS export that flattens them. The screenshot below annotates the four numbers worth reading every week.
- 1Intake-to-screen pass rate. Out-of-band readings here are kickoff problems, not screening problems.
- 2Screen-to-onsite pass rate. Spread across recruiters on the same role is the early warning for screen drift.
- 3Onsite-to-offer pass rate. Tracks panel decision discipline more accurately than offer-acceptance does.
- 4Cumulative ITHR. The receipt at the end. Useful as a movement check across quarters, useless as a target on its own.
The reason this view changes how teams operate is that it makes the cause visible alongside the effect. A recruiter who sees screen-to-onsite at 18% on their roles and 42% on a peer's roles asks the right question (am I screening differently?) inside the first review meeting. A hiring manager who sees the onsite-to-offer rate on their loop drop 12 points while every other panel holds steady asks the right question (is my panel calibrating against the wrong scorecard?) before three more candidates get rejected for the wrong reasons. The dashboard moves the conversation upstream automatically.
Most people convince themselves when they have failures that they are experimenting, and they do not necessarily have the intellectual discipline to truly control the variables and truly try to get to what a meaningful conclusion could look like.”
What changes when interview signal becomes the input
The hardest part of moving from vanity ITHR to a diagnostic ratio stack is not the math. The math is identical. The difference is what the team optimizes for each week. Below is the operating contrast I run with talent leaders the first time we install the stack.
- Cut panel rounds to compress the cumulative ratio. Signal capture shrinks with it.
- Tighten screen pass-through to reduce onsite volume. Drift between recruiters goes invisible.
- Push hiring managers to decide faster. Debriefs collapse into the loudest opinion.
- ITHR improves on the dashboard. Offer-acceptance and 90-day attrition slowly degrade in parallel.
- Every interview captured as structured signal, not vibes in someone's notes app.
- Three upstream ratios watched alongside the cumulative ratio every week.
- Out-of-band readings route to the correct stage automatically: intake, screen, or panel.
- ITHR moves down because the upstream signal moves up. The two stay coupled by design.
Most teams underestimate how much of the current ITHR they read is artifact of process drift rather than role difficulty. The diagnostic stack quietly isolates the difficult roles (the ones whose ratio genuinely will not bend without market-rate changes) from the loose roles (the ones whose ratio is inflated by leak patterns the team can fix this quarter). The first is a hiring strategy problem. The second is an operating discipline problem. They get confused with each other constantly when ITHR is the only number on the dashboard.
The four-week ITHR diagnostic plan
If the diagnostic stack is unfamiliar, install it in four weeks. The plan below is the same one I walk through with talent leaders in their first 30 days, refined across the last 18 Metaview rollouts. It assumes the team already has an ATS and a basic structured-interview habit. It does not assume any prior reporting work.
- Week 1: Baseline. Pull the last 90 days of pipeline. Compute the three upstream ratios per recruiter and per role family, then the cumulative ITHR. Plot every out-of-band recruiter or role. Do not change anything yet. The point of week one is to see where the leaks are, not patch them.
- Week 2: Capture layer. Turn on Metaview Notetaker for every screen and onsite. Install the structured scorecard templates the dashboard reads from. Recruiters and panelists keep doing exactly what they were doing in week one. The only change is the record.
- Week 3: Read the stack. Hold a 30-minute weekly review with the three ratios on screen. Walk the spread across recruiters on each open role. Identify the one out-of-band reading nobody can explain. That is your first leak to chase.
- Week 4: Close the loop. Adjust the intake template, the screen scorecard, or the panel debrief based on what the stack showed. Re-baseline at the end of the week. Most teams see ITHR move 0.5 to 1.5 interviews per hire by week six without any change to the funnel itself.
 Metaview Technologies
When to stop tweaking and rebuild the funnel
Sometimes the three upstream ratios all sit in band and ITHR is still uncomfortable. That case is real, and it is structural. If intake-to-screen is healthy, screen-to-onsite is healthy, onsite-to-offer is healthy, and ITHR is still high, the funnel design itself is the constraint. Common signs: panels over five interviewers, two-round screens that overlap, intake that is never standardized across hiring managers, role families where the seniority band is too wide to support a single scorecard. None of those get fixed by reading the diagnostic stack better. They get fixed by rebuilding the funnel.
The signal that says it is time: ITHR has plateaued for three quarters in a row, the three upstream ratios are all in their healthy bands, and the team is still running more interviews per hire than competitors of similar size and seniority. At that point the next move is not another scorecard. It is a funnel redesign, ideally with the signal layer already in place so the redesign has data to land on. The teams who get the biggest ITHR drops in 2026 will be the ones who installed the diagnostic stack first and used it as the baseline for whatever they tear down next.
We have actually saved about 70 working days for recruiters.”
Bring Metaview into your hiring stack.
Live notes, structured scorecards, and ATS sync - set up in under 10 minutes.
Frequently asked questions
What is a good interview-to-hire ratio?
There is no universal benchmark. Most knowledge-work roles land between 5:1 and 12:1 cumulative, with senior and executive roles sitting above that band. The more useful question is not the absolute number but whether the three upstream ratios that produced it (intake-to-screen, screen-to-onsite, onsite-to-offer) are each inside their own healthy bands. A 6:1 with all three upstream ratios in band is a healthy funnel. A 6:1 with one upstream ratio collapsed is hiding a problem.
How do I calculate interview-to-hire ratio?
Total candidate interviews divided by total hires over the same period, for the same role or role family. Count every distinct candidate interview, including screens, technical rounds, and onsite panels. Do not count individual interviewer slots inside one round (a 4-person panel is one interview, not four). Pull the same window for both sides of the ratio so you are not comparing today's interviews against last quarter's hires.
Why does ITHR get worse when teams try to optimize it directly?
The easiest way to drop ITHR on paper is to remove a panel round, auto-advance more candidates from the screen, or compress the debrief. Each of those moves shrinks the signal the funnel captures. ITHR improves in the short term and offer-acceptance, quality of hire, and 90-day attrition degrade in parallel. The trade is invisible on the dashboard because those metrics live in separate reports. Reading the diagnostic ratio stack instead moves the cause upstream and the ITHR drop becomes the side-effect of better signal, not a substitute for it.
Which upstream ratio is the biggest lever?
Across most audits, it is screen-to-onsite. The screen is the only stage where one person can move the entire funnel without coordination. A two-week tightening of the screen scorecard, paired with structured Notetaker capture, pulls 1 to 2 interviews per hire out of the system more reliably than any panel-redesign exercise. Intake-to-screen is the longest-leverage lever but the slowest to move (kickoff habits are sticky). Onsite-to-offer is the highest-trust lever but only works after panels see structured signal coming out of the screen.
Where does Metaview fit in the ratio stack?
Metaview is the signal layer beneath each ratio. Notetaker captures the actual interview content (not the interviewer's recollection of it). AI Notes turns the capture into structured scorecard outputs. Reports surfaces the three upstream ratios alongside cumulative ITHR. ATS sync writes the structured outputs back so the existing pipeline reporting sees them. Nothing in the recruiter or panel workflow changes day-to-day; the record changes, and the record is what makes the diagnostic stack readable.