
If your team is measuring sourcing on "candidates added to pipeline" alone, you're measuring the easiest number, not the most useful one.
The metrics that actually predict whether sourcing is working sit further down the funnel: which channels produce candidates who survive the interview, which messages get a real reply, how fast feedback closes the loop.
We see 4,000+ organizations run sourcing through Metaview every day. Here are the 10 metrics that distinguish the teams getting steady offer acceptances from the teams stuck at the top of the funnel.
All 10 metrics at a glance
| # | Metric | What it tells you | Healthy benchmark |
|---|---|---|---|
| 1 | Time to launch | How fast sourcing starts after a req opens | Under 3 business days |
| 2 | Outreach response rate | Whether the message lands | 25-40% for sourced candidates |
| 3 | Sourced-to-interview conversion | Whether you're sourcing the right shape of candidate | 30-50% |
| 4 | Quality of hire by channel | Which sourcing channels produce keepers | Tracked per channel, compared every quarter |
| 5 | Offer acceptance rate | Whether the funnel converts at the end | 85-90% on strong teams |
| 6 | Time to fill | Total elapsed time from req open to accepted offer | Role-dependent; trend matters more than absolute |
| 7 | Time to feedback | Gap between interview and hiring-manager feedback | Under 24 hours; best-in-class is 10-20 minutes |
| 8 | Cost per hire | All-in spend per closed offer | Watch the trend; absolute varies by role family |
| 9 | Candidate satisfaction score | How sourced candidates rate the process | 4.2/5 or higher on a post-process survey |
| 10 | Sourcing channel efficiency | Hires divided by candidates sourced, per channel | Top two channels usually drive 80% of hires |
1. Time to launch
What it measures: the time between a req opening and the first sourced candidate hitting the pipeline.
Why it matters: every day of delay at the front of the funnel becomes a day of delay at the back. Teams that take a week to launch sourcing don't recover that week later.
How to move it: standardize intake calls, pre-build candidate pools per role family, and use AI sourcing that runs from the JD instead of waiting for a Boolean string. Healthy teams launch sourcing within 72 hours of req approval.
2. Outreach response rate
What it measures: the percentage of contacted candidates who reply.
Why it matters: it's the single best leading indicator of message quality. Below 5%, the platform is being filtered or your targeting is off. Above 25%, the message is doing real work.
How to move it: personalize the first 12 words of every message. Track response rate per recruiter and per channel separately; the variance between recruiters on the same team is usually 3-5x.
3. Sourced-to-interview conversion rate
What it measures: the share of sourced candidates who make it to a real interview.
Why it matters: this is the metric that tells you whether the people you're finding are the right shape, not just the right keyword. A pipeline that responds but doesn't convert is sourcing the wrong profile.
How to move it: calibrate the brief with the hiring manager before sourcing starts, not after the first reject. Strong teams hit 30-50% conversion from sourced to first interview.
4. Quality of hire by channel
What it measures: the retention and performance of hires segmented by sourcing channel.
Why it matters: not all channels produce equally strong hires. Referred candidates often stay twice as long as job-board hires.
Most teams don't run this analysis and end up overspending on channels that produce churn.
How to move it: tag every candidate with source-of-hire on day one. Review channel-to-quality data quarterly and reallocate budget toward the channels feeding the survivors.
5. Offer acceptance rate
What it measures: the percentage of issued offers that get accepted.
Why it matters: a low rate isn't always a compensation problem. Usually it's a candidate-experience problem masquerading as one. Slow feedback, inconsistent interviewers, and unclear next steps cost more offers than salary does.
How to move it: shorten time-to-feedback (see metric 7), brief interviewers on the candidate before each round, and make the final stretch feel proactive instead of administrative. Top teams close 85-90% of offers.
6. Time to fill
What it measures: total elapsed time from req open to accepted offer.
Why it matters: it's the universal KPI executives ask for, but it hides where the time actually goes. Tracking it for sourced candidates separately surfaces whether sourcing efficiency is the bottleneck or something downstream is.
How to move it: instrument the funnel stage by stage. Time to launch + time to first interview + time to feedback + time to offer = the four buckets to compare against your peers.
7. Time to feedback
What it measures: the gap between the end of an interview and structured feedback in your ATS.
Why it matters: it's the metric most teams ignore and it's the one with the highest leverage. Days lost between interview and feedback compound into weeks lost overall.
Candidates ghost. Hiring managers forget the specifics. Candidate experience tanks.
All of our hiring team said that Metaview saves them hours. We're now getting feedback from hiring managers in 10 to 20 minutes, which is just ideal for a recruiting team that works with time-to-hire targets.”
How to move it: capture the interview structurally so the scorecard exists the moment the call ends. Hiring managers fill in faster when the rubric is already populated.
8. Cost per hire
What it measures: total spend (tools, ads, recruiter time, agency fees) divided by hires made.
Why it matters: the absolute number varies wildly by role family, so the trend is what to watch. A flat cost per hire while quality of hire rises is a real win. A falling cost per hire while quality drops is a problem dressed up as a result.
How to move it: automate the high-volume, low-judgment work (initial outreach drafts, scheduling, note-taking) so recruiter time concentrates on the late-funnel calls that drive acceptance.
9. Candidate satisfaction score
What it measures: how sourced candidates rate the experience on a post-process survey.
Why it matters: candidate experience compounds. Today's rejected candidate is next year's hire or next month's negative review. Teams that ignore CSAT discover the damage in offer-acceptance numbers six months later.
How to move it: survey every candidate including the rejects. The honest signal usually comes from the ones you didn't hire.
10. Sourcing channel efficiency
What it measures: hires divided by candidates sourced, per channel.
Why it matters: almost every team is running more channels than they need. Channel efficiency analysis usually shows two channels driving 80% of hires and the other four costing more time than they return.
How to move it: run the analysis quarterly. Cut the bottom-performing channel for one quarter and watch what happens. If hires don't drop, the channel was noise.
Where Metaview fits
Most of the metrics on this list die in a spreadsheet that nobody updates. The data is real, but it lives in three tools and lands too late to change a single decision.
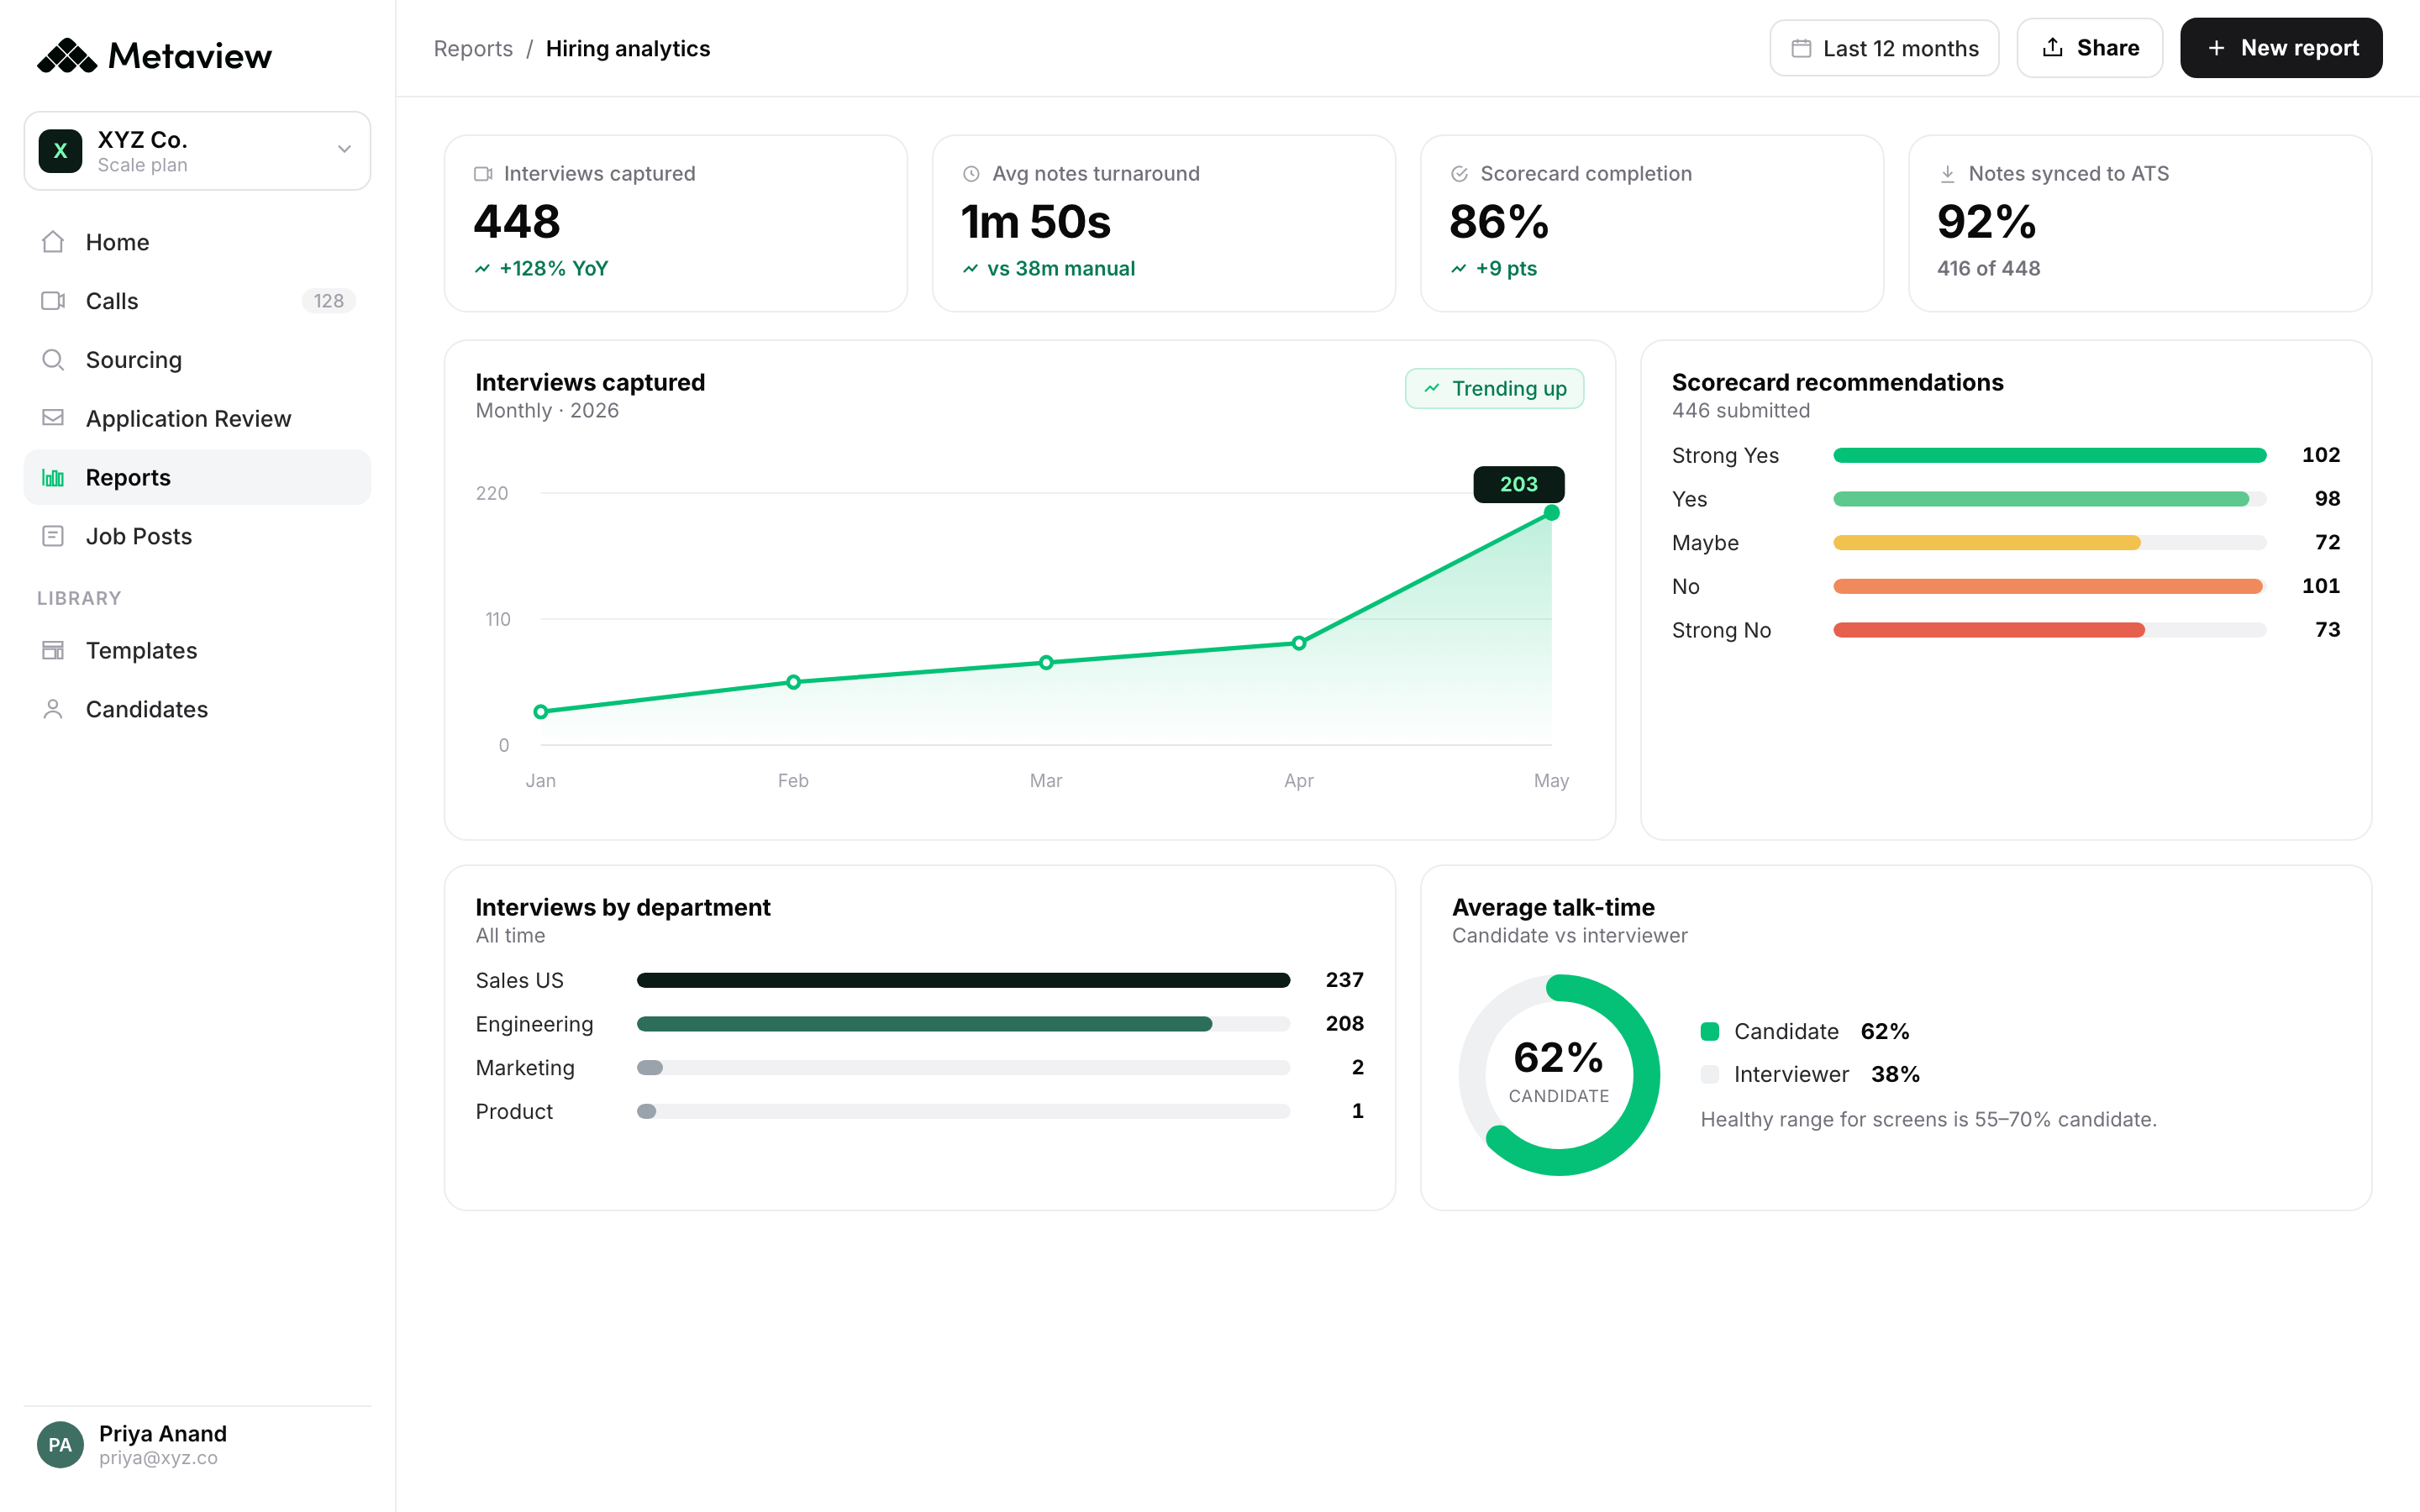
Metaview captures every interview, maps answers to your rubric, and writes the scorecard back to your ATS the moment the call ends. That turns the metrics you have to chase into ones that update on their own: time to feedback, scorecard completion, notes synced to your ATS, and the per-department breakdown that shows which parts of the funnel are actually converting.
It is the one dashboard that already holds the numbers a quality-of-hire and channel-efficiency review depends on:
How to make the metrics move
The metrics on this page are the dashboard. The interventions that move them are simpler than the dashboard suggests.
Most teams overspend energy tracking and underspend energy fixing. The two interventions worth doing first: shorten time-to-feedback by capturing interviews structurally, and run channel efficiency every quarter so reallocation happens before the budget review.
Metaview captures every interview across Zoom, Google Meet, Microsoft Teams, and phone, maps answers to your rubric, and writes the scorecard back to your ATS.
That single change collapses time-to-feedback into minutes and gives you the per-channel data quality-of-hire analysis requires.
4,000+ organizations now run sourcing and interview capture on Metaview, including Brex, Quora, Workleap, Cleo, Catawiki, Replit, Robinhood, and Automattic.
Bring Metaview into your hiring stack.
Live notes, structured scorecards, and ATS sync, set up in under 10 minutes.
Frequently asked
Which sourcing metrics should I prioritize?
Start with three: outreach response rate (message quality), sourced-to-interview conversion (targeting), and quality of hire by channel (where the keepers come from). Get those three right before adding the rest.
What's a good outreach response rate in 2026?
25-40% for personalized sourcing, depending on role and seniority. Cold templated outreach lives around 4-8%. The first-12-words rule matters more than every other variable combined.
How do I measure quality of hire by channel?
Tag every candidate with source on day one, then look at retention at 6 and 12 months and performance ratings by source. The simplest version compares the two metrics side by side in your ATS reporting.
What tools track sourcing metrics automatically?
Greenhouse, Ashby, Lever, and Workday all expose pipeline-level metrics. For interview and feedback metrics specifically, Metaview integrates with your ATS to capture interview outcomes and time-to-feedback automatically.
How often should I review these metrics?
Pipeline metrics (response rate, conversion, time-to-feedback) weekly. Outcome metrics (quality of hire, channel efficiency) quarterly. Reviewing the outcome metrics too often invites noise; reviewing the pipeline metrics too rarely lets problems compound.
What's the single highest-leverage metric to fix first?
Time to feedback. Most teams ignore it. Fixing it cascades into time-to-fill, candidate experience, and offer acceptance, without requiring a single change to sourcing.