
The hiring plan you send the CFO in January is wrong by April. Not because the strategy changed. Because the inputs were stale on the day you wrote it. Cycle times come from gut feel. Capacity comes from a recruiter’s self-report. Interviewer load comes from whoever flagged loudest in standup. By the time the spreadsheet hits the all-hands, the plan describes a different company than the one hiring.
A living hiring plan fixes that. It pulls cycle-time, interviewer load, and feedback-lag data from the interviews the team is already running, refreshes the targets weekly, and turns the quarterly artifact into a dashboard the TA leader actually defends in front of finance.
This post is for the TA leader who needs to commit headcount to the business and wants the plan to match the data instead of the wishful thinking. We walk the six inputs every plan needs, the four that should come straight from interview-intelligence data, and the template you can stand up in a week.
What a hiring plan actually is (and the failure mode most TA orgs hit)
A hiring plan is the operating commitment a TA org makes to the business: this many hires, in these roles, by these dates, at this cost-per-hire and this cycle time. Done right, it is the contract the TA leader defends to finance and the resourcing plan the recruiters execute against.
Most plans break in the same place. The plan is written from a target (12 hires by end of Q2) but not from the inputs that decide whether the target is achievable (recruiter capacity, average cycle time by role level, interviewer load against the existing book). The numbers in the plan don’t come from the data the team actually generates; they come from last year’s spreadsheet with a multiplier.
The failure mode is structural: the plan is built and frozen on day one of the quarter, and the inputs that would tell you it’s wrong (cycle times slipping, feedback lag growing, interviewer load concentrating on three people) sit in the interview corpus the team is running every week. Nobody pulls them into the plan because pulling them is manual.
Be data-driven and articulate: this is what I’m doing, this is why I’m doing it, this is what it’s going to cost, and this is what you’ll get. If the number sounds reasonable, we rock and roll. You can’t come in with the Google playbook and slap it down. Organ rejection is real.”
The six inputs every hiring plan needs
A hiring plan that survives the quarter has six inputs. The first two come from the business; the other four come straight from your interview data, if you are capturing it.
1. Business goals and headcount targets (from finance)
The starting point most TA orgs already have. Revenue plan, product roadmap, and the headcount commitments that fall out of both. This is the input that anchors the plan, not the one that breaks it. Source: your finance partner’s headcount model.
2. Role definitions and success criteria (from hiring managers)
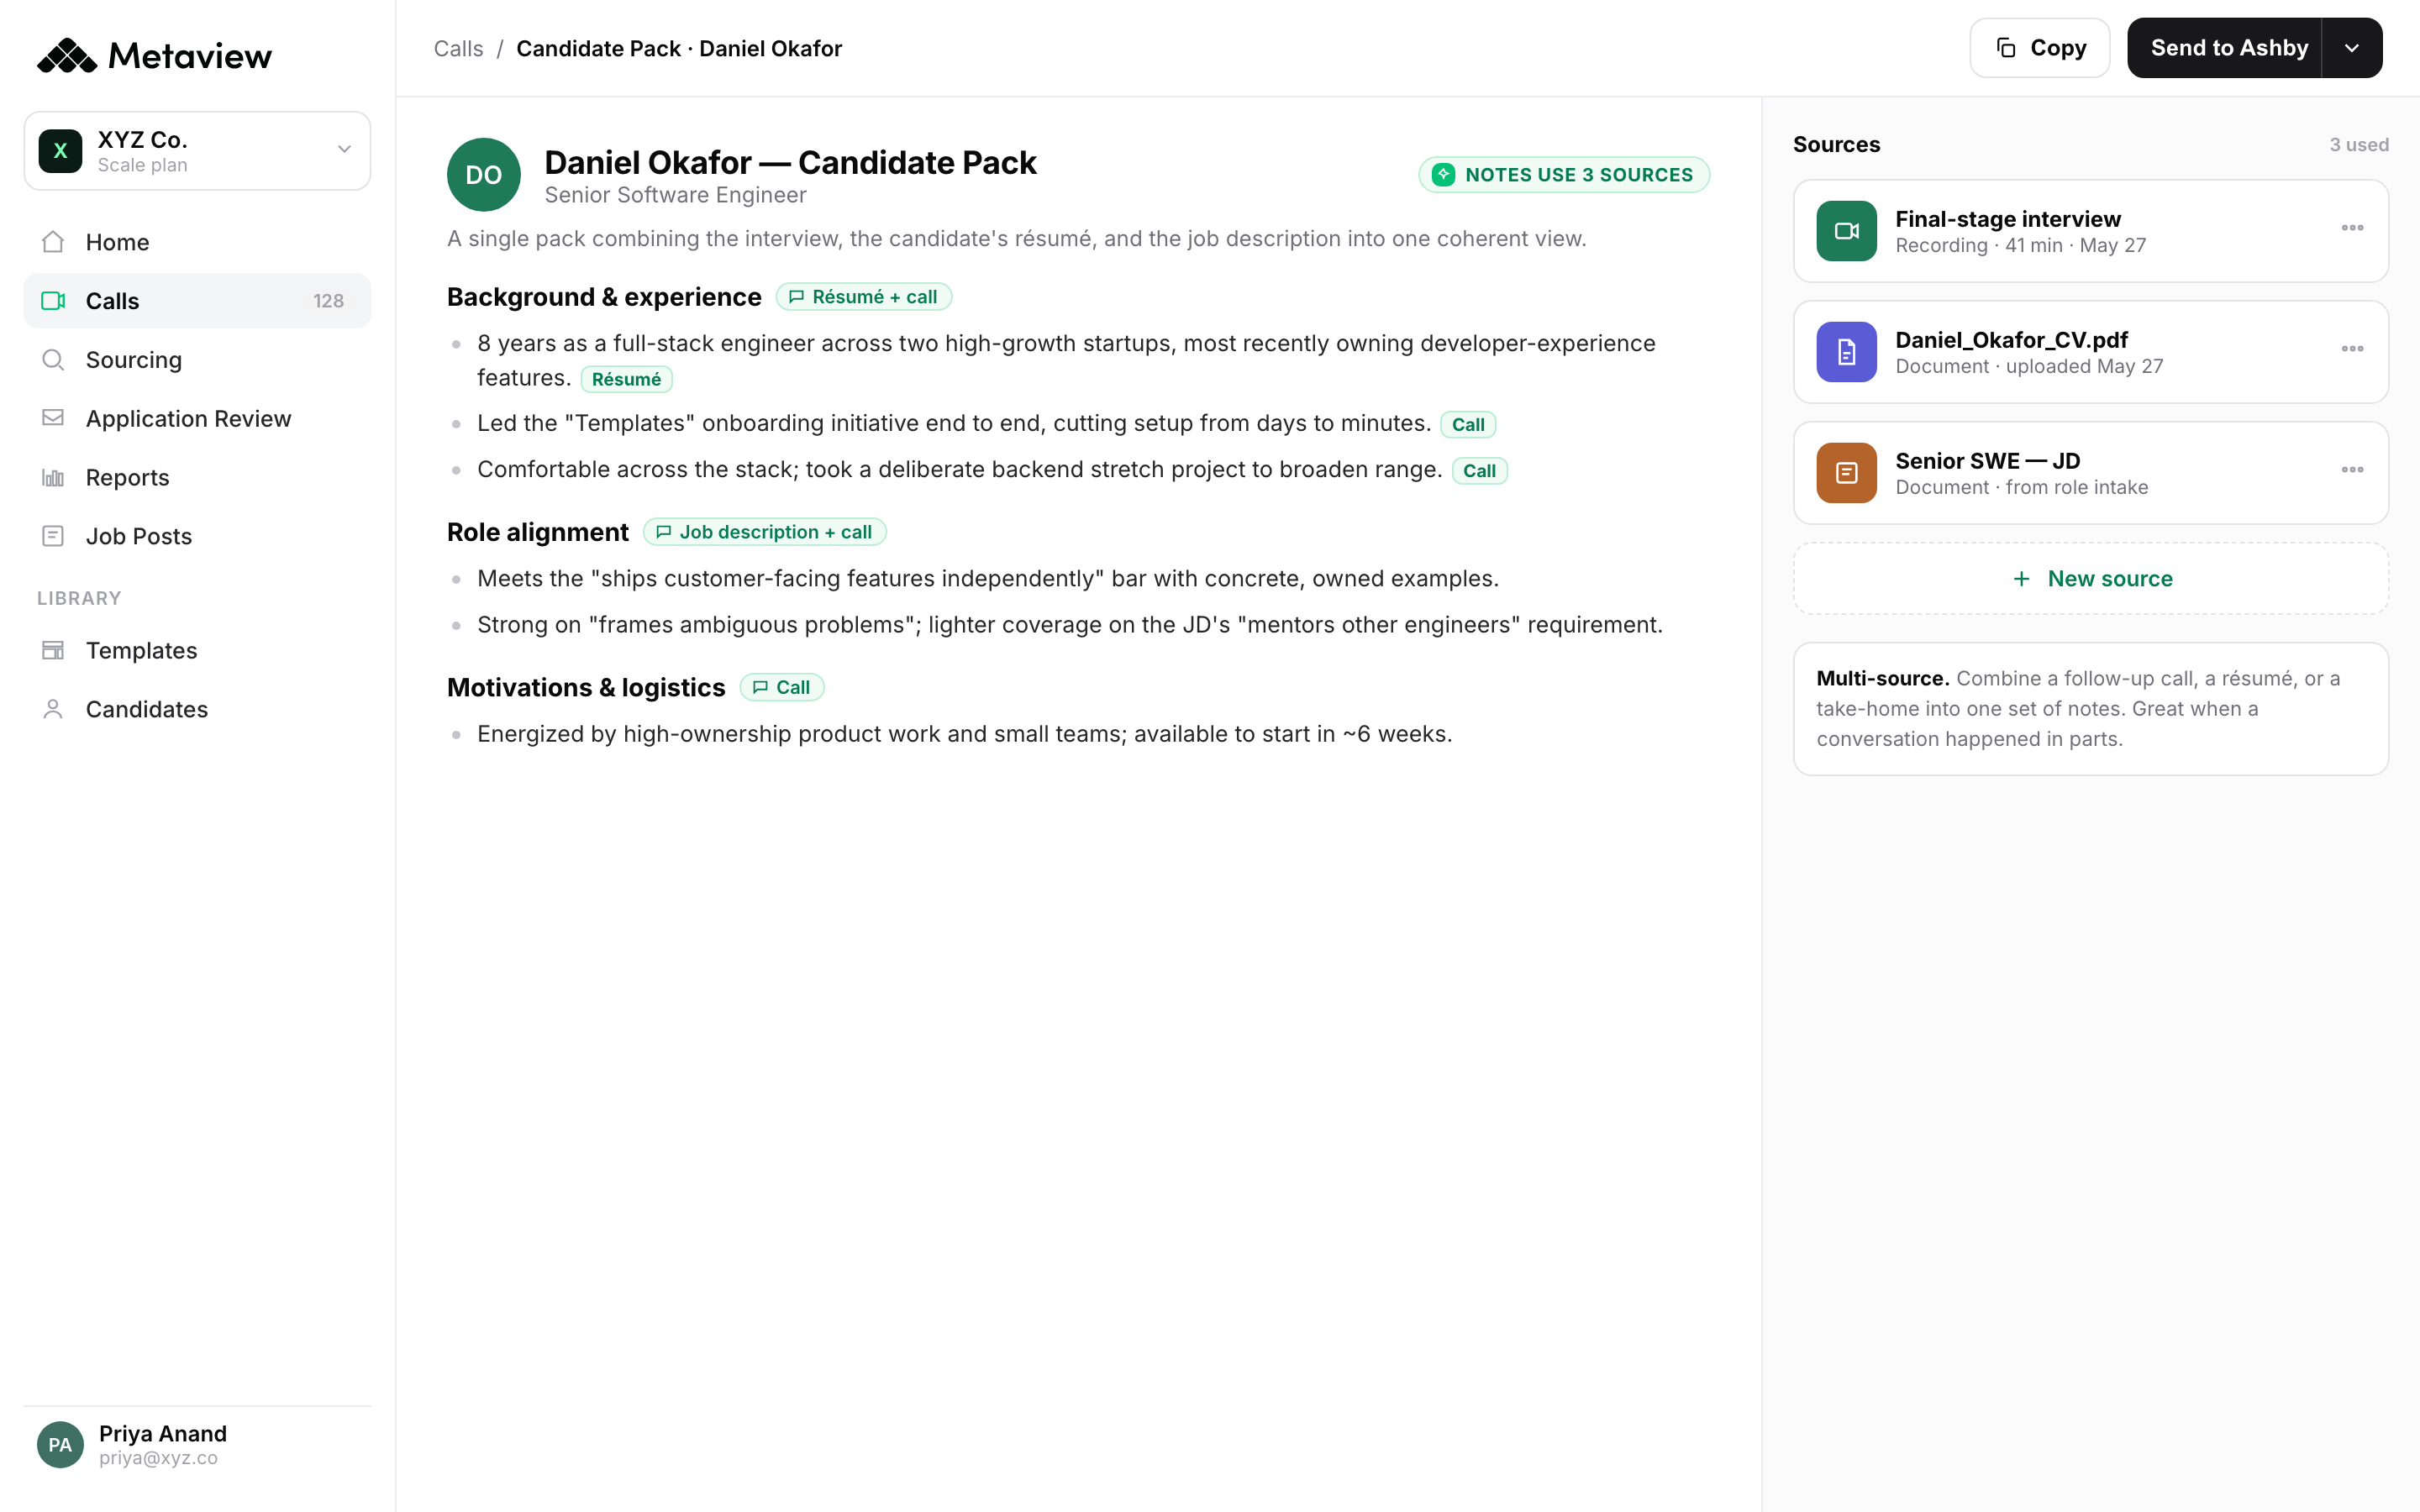
What “a senior backend engineer” means in this role on this team this year. The intake call is where this gets defined, and the calibration brief the recruiter and hiring manager align on becomes the durable spec for the search. If the brief lives in someone’s notebook, the spec drifts by week three. If it lives in structured intake notes, it carries through every panel.
3. Recruiter capacity (from cycle-time data)
How many concurrent searches each recruiter can carry without quality dropping. The naive answer is “eight to twelve.” The real answer comes from cycle-time data per recruiter: average days from kickoff to offer, average days they spend per req per week, and the ceiling above which time-to-offer slips. That data sits in your interview corpus, not in a Slack poll.
4. Interviewer load (from panel-staffing data)
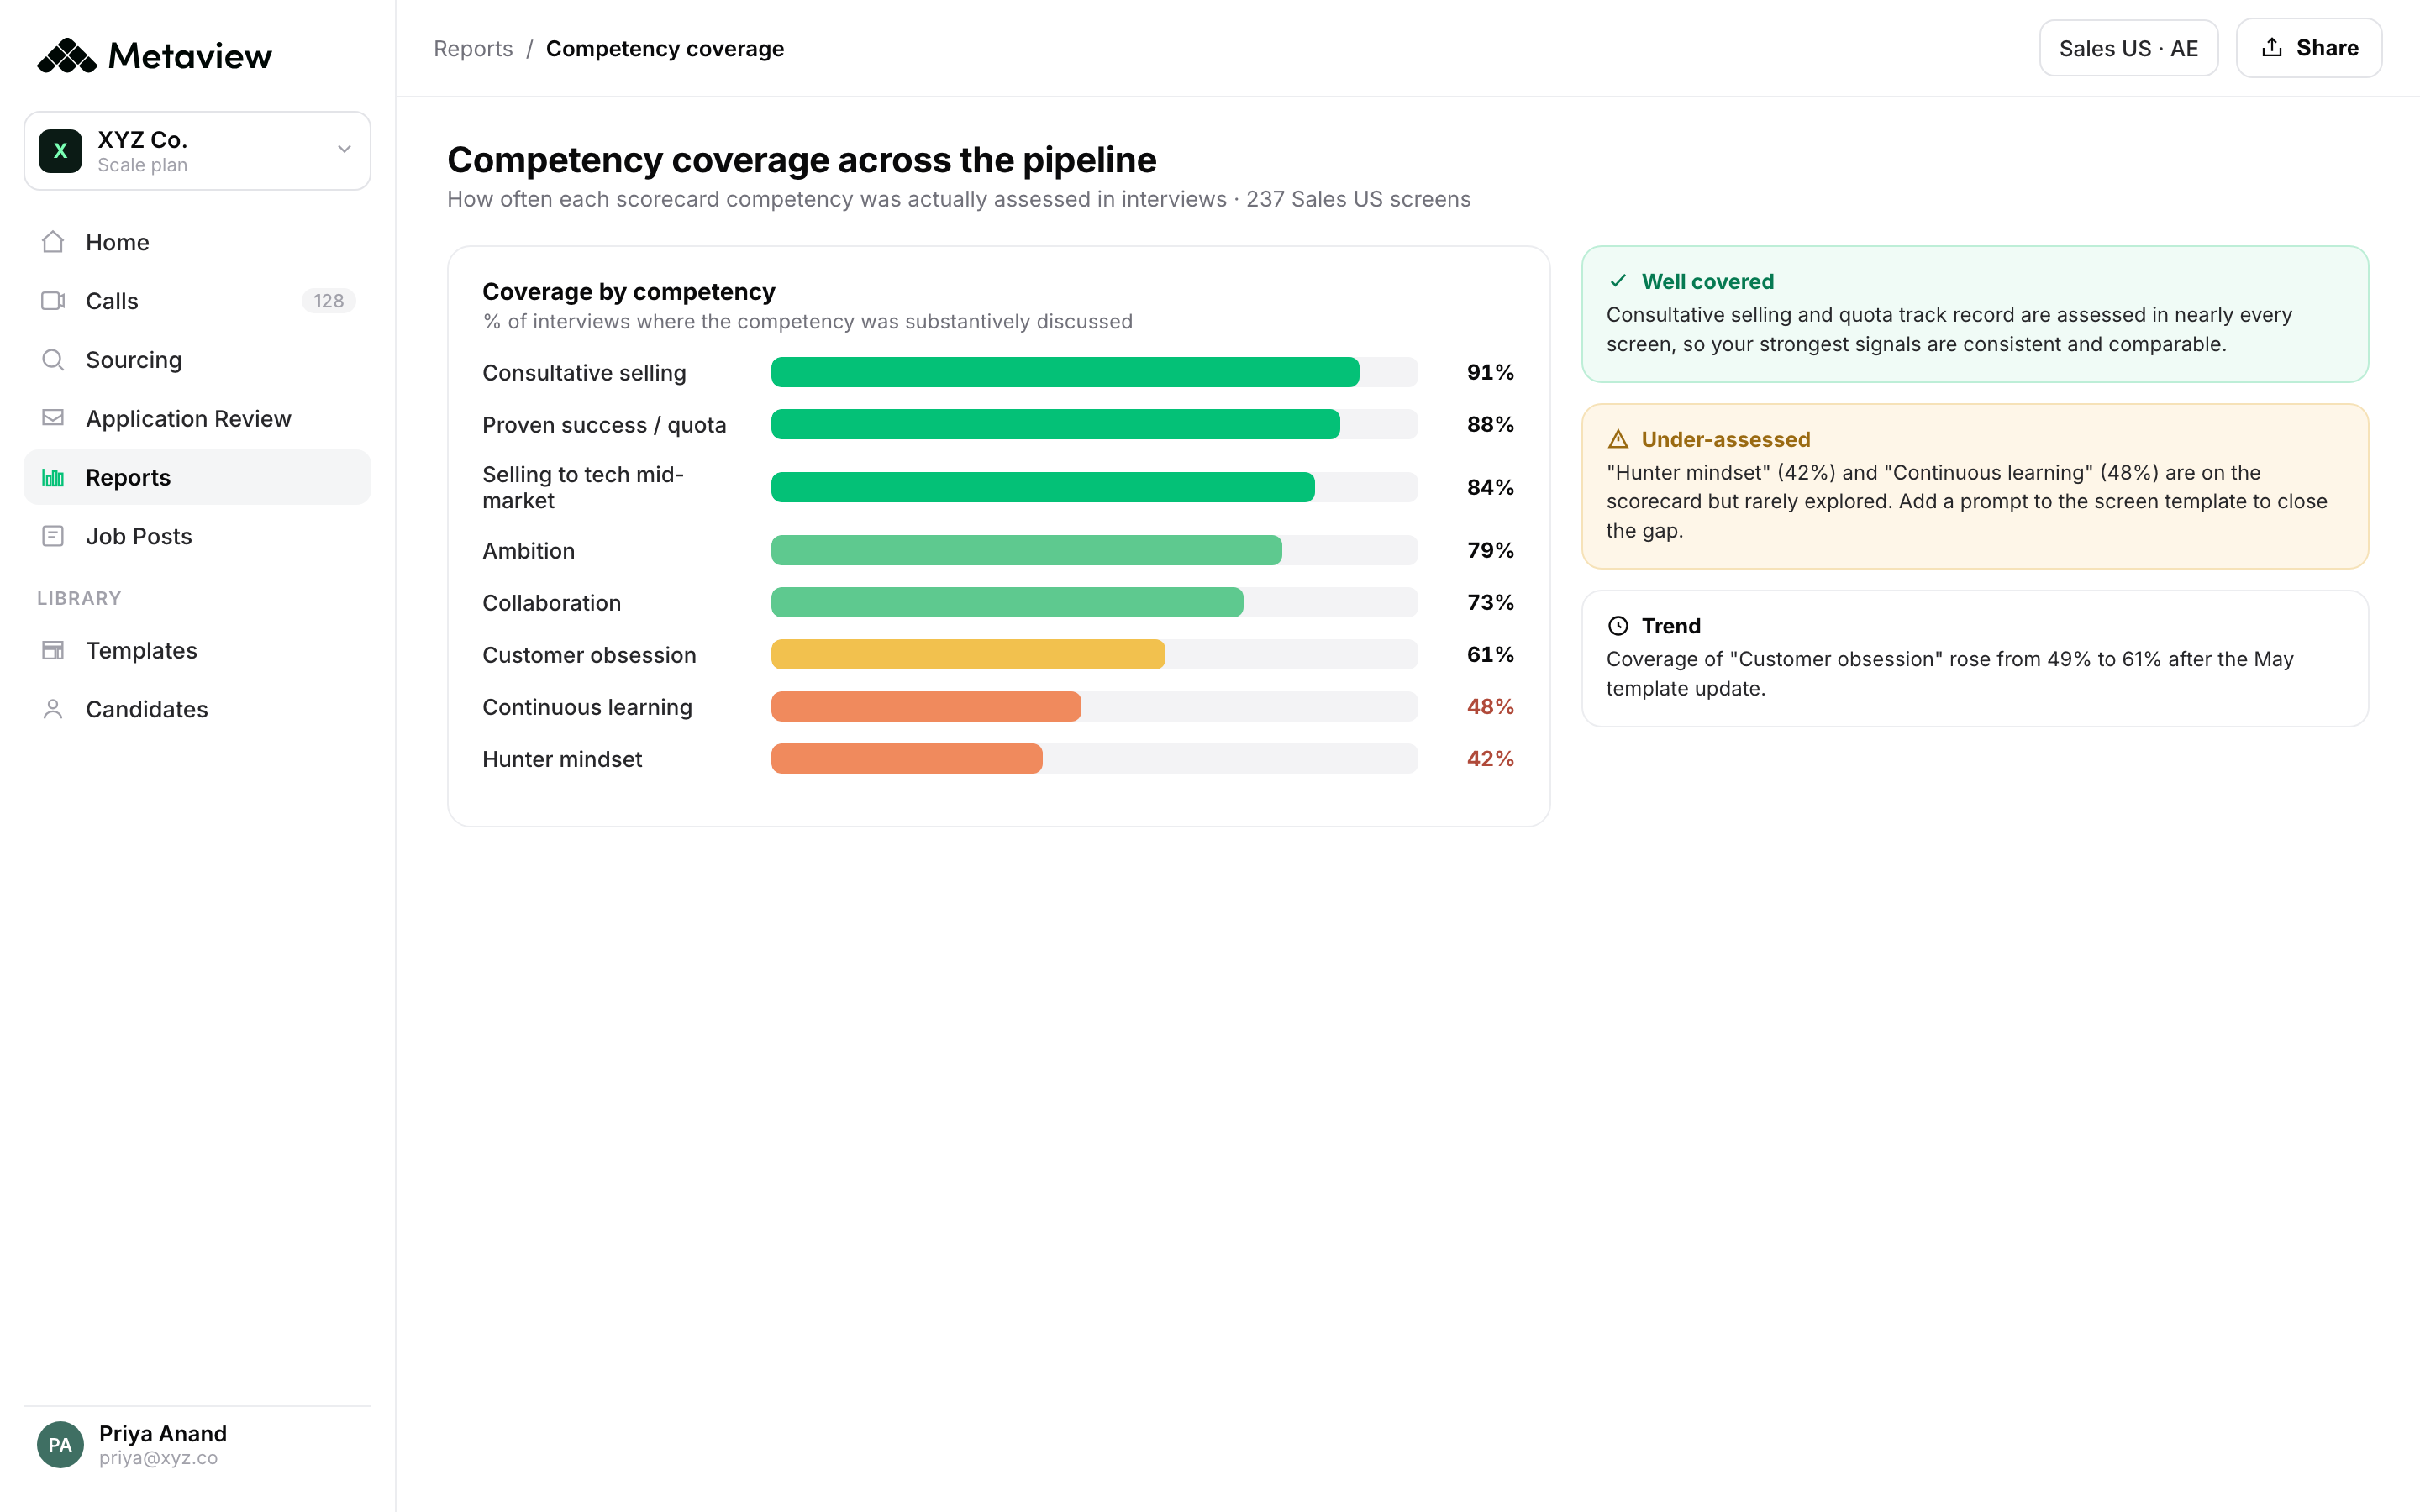
Which interviewers are getting tapped for which loops, and how often. Most TA orgs discover six months in that 80% of senior IC interviews are run by the same four panelists, who are now interview-fatigued. The signal that catches this exists in every panel kit you generate; the plan just has to consume it.
5. Feedback lag (from debrief-to-offer-prep timing)
Days between final round and offer being made. This is the single highest-leverage segment of cycle time and the one most TA orgs do not track separately. If your average is more than two business days, the bottleneck is debrief lag, not sourcing speed. The data lives in the debrief and offer-prep workflow.
6. Sourcing yield by channel (from candidate-corpus data)
Which channels (inbound, outbound, referral, agency) produce candidates that convert to offers, segmented by role level. Most plans assume a flat conversion rate; the data says the conversion rate varies by 4x across channels at the senior IC level. The plan should index headcount-by-channel against the conversion data, not against the prior year’s allocation.
How Metaview turns the plan into a living dashboard
The shift is not from no plan to plan. It is from a static artifact to a living dashboard. The capture layer is what makes the shift possible.
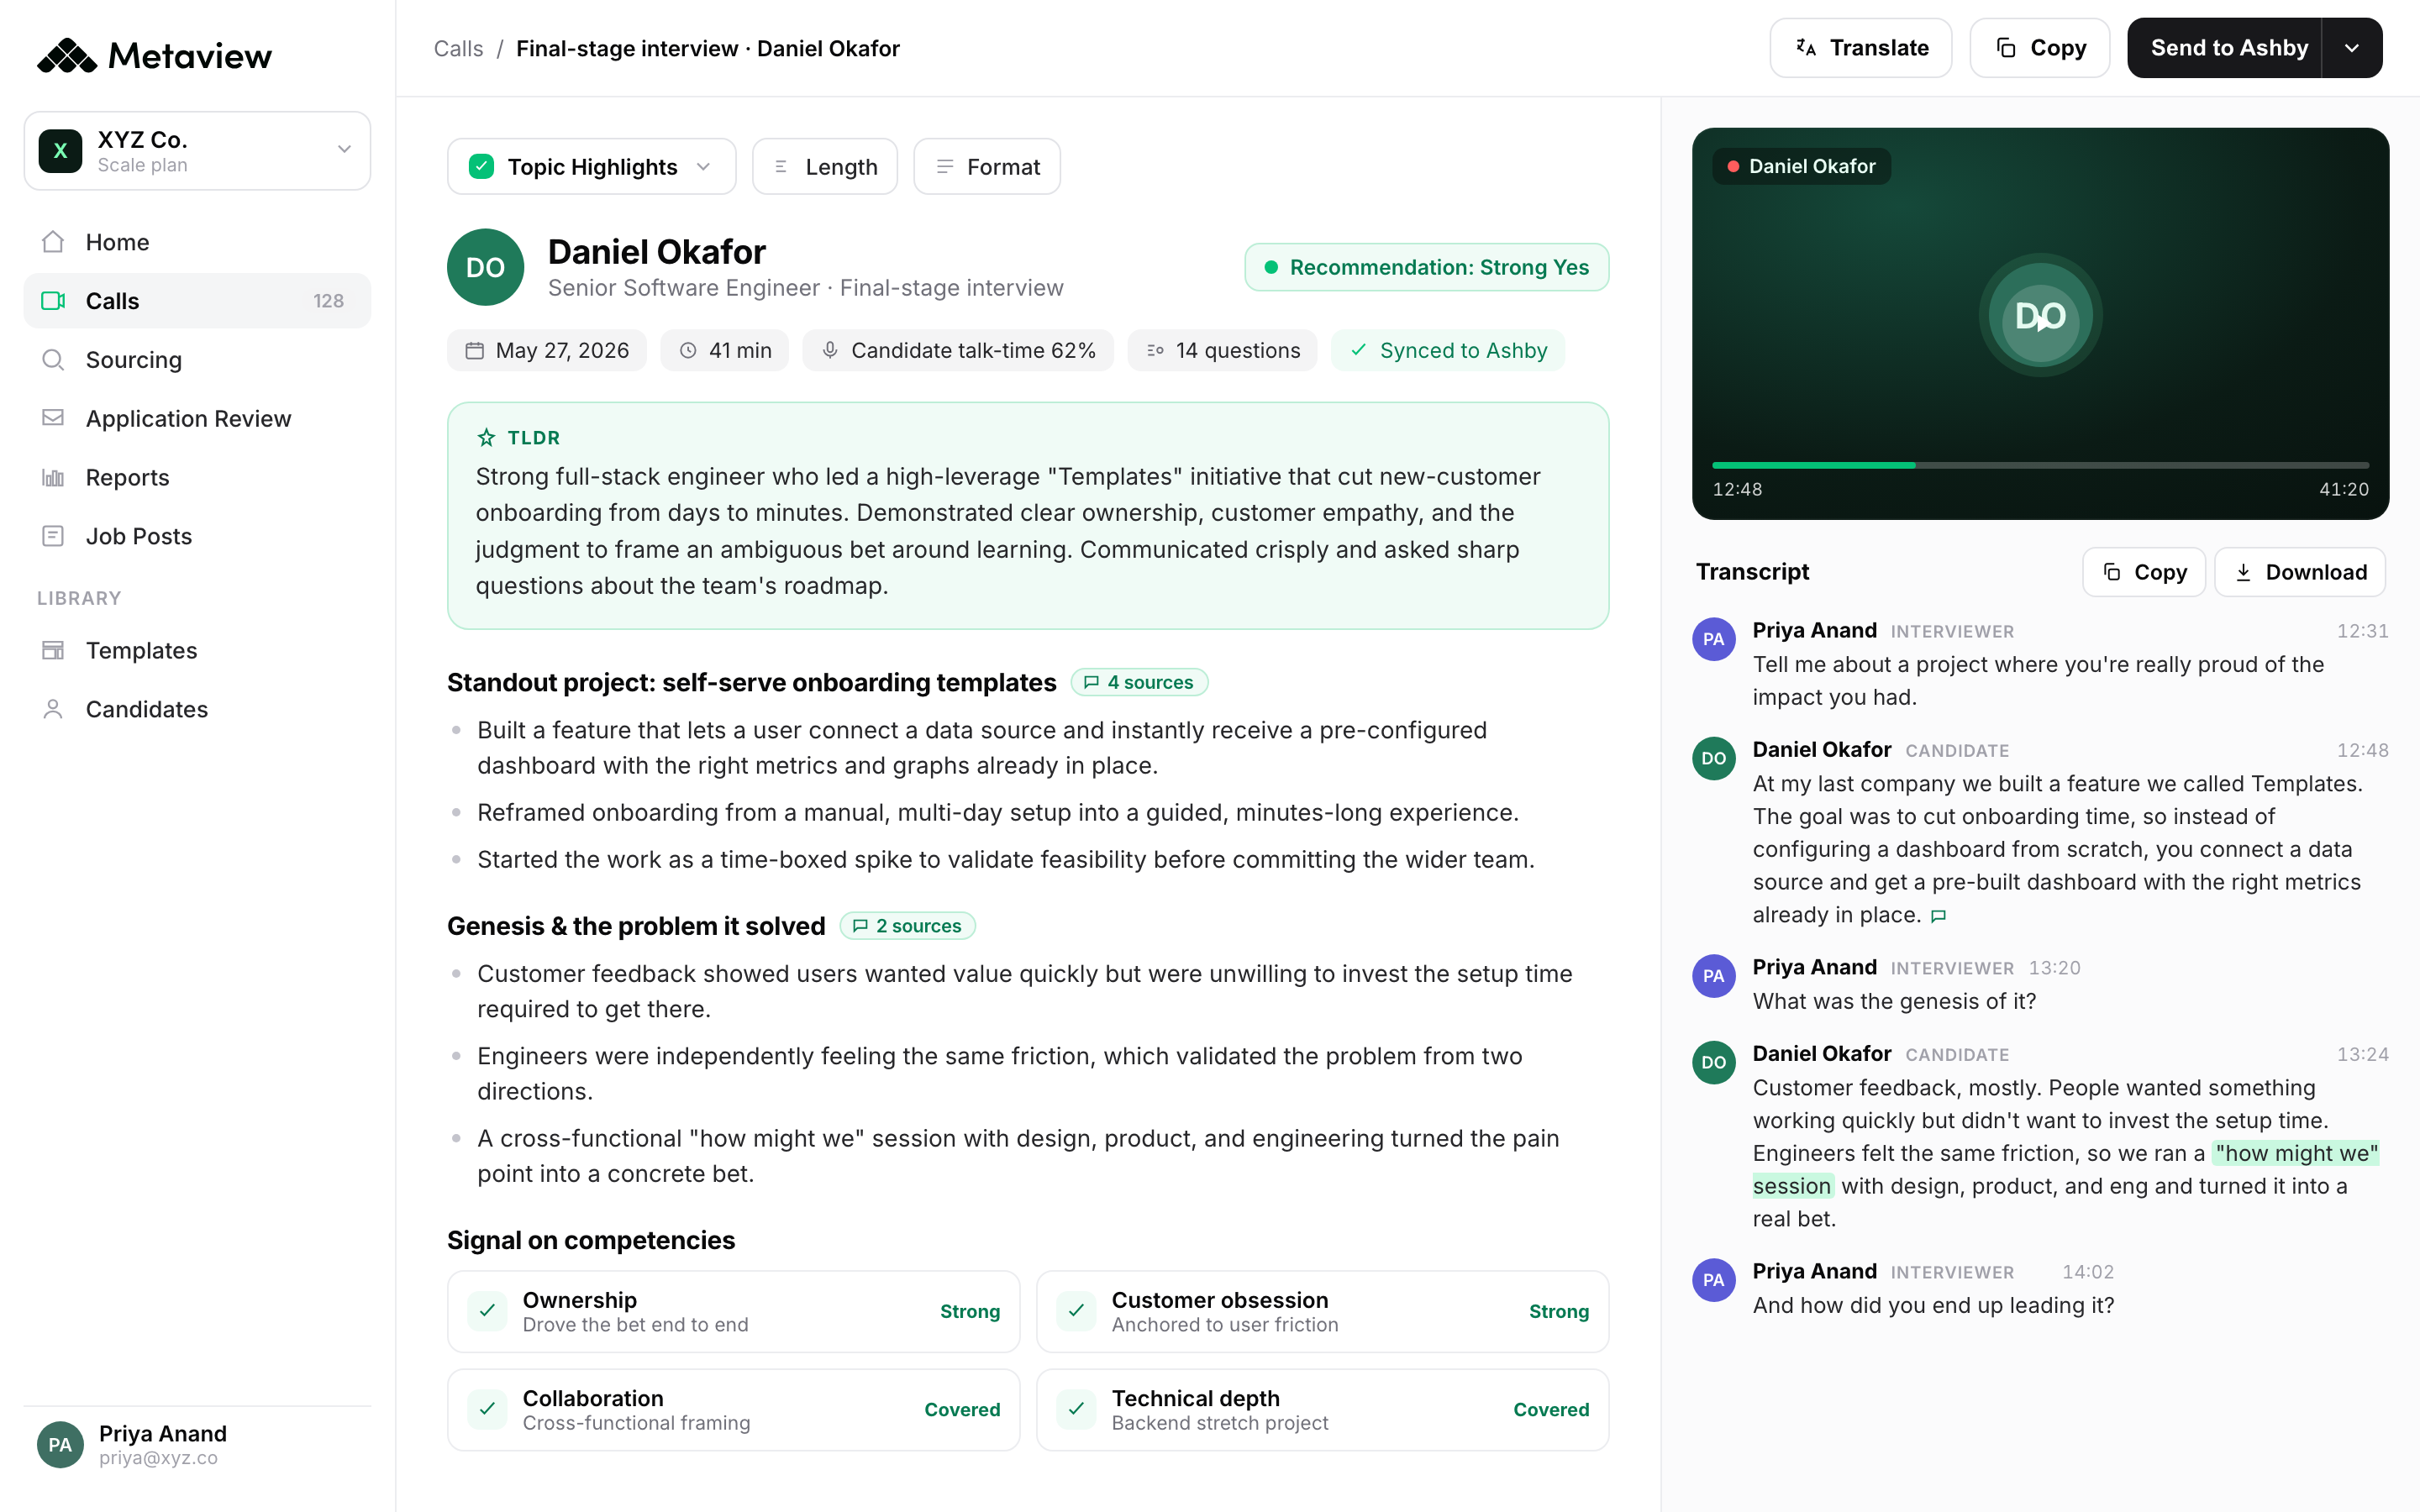
Metaview captures the interviews your team is already running, structures the signal per-competency, and pushes the metrics that matter (cycle time, interviewer load, feedback lag, sourcing yield) into a surface the TA leader refreshes weekly. The plan stops being a document and starts being a dashboard. The 12 hires in Q2 commitment gets updated against the actual cycle-time data on the actual panels in flight.
See our take on time-to-hire for the operational detail on the four post-interview segments where days actually vanish - the same data feeds the living hiring plan.
Quarterly artifact vs. living dashboard
The same six inputs, broken down by how each one is treated in three states: the quarterly artifact most TA orgs run today, the spreadsheet-refresh state, and the living dashboard state.
| Plan input | Quarterly artifact | Spreadsheet refresh | Living dashboard (Metaview-augmented) |
|---|---|---|---|
| Cycle time by role level | Last year’s average, with a 10% buffer. | Manual pull from ATS at end of quarter. | Per-panel cycle-time data refreshed weekly. Surfaces the slips at week three, not week thirteen. |
| Recruiter capacity | Self-reported in the planning meeting. | Calculated once per quarter from req count. | Capacity ceiling computed from actual days-per-req data per recruiter, across the live book. |
| Interviewer load | Not tracked; flagged by complaint. | Quarterly audit of panel staffing. | Continuous: panel kits aggregate per-interviewer load and flag the four-person concentration. |
| Feedback lag | Not tracked separately from time-to-hire. | Manually computed from offer dates. | Captured automatically from the debrief-to-offer-prep gap. Triggers an alert when the median exceeds two days. |
| Sourcing yield | Channel mix copied from prior year. | Conversion calculated quarterly. | Conversion rate per channel per role level, refreshed weekly from the candidate corpus. |
| Calibration drift | Discovered at week four when the panel disagrees. | Not tracked. | Intake brief carries through every panel; drift surfaced when later evaluations diverge from week-one calibration. |
Common failure modes (and the early warning signal that catches each)
A living plan does not eliminate failure modes. It catches them earlier, when there is still time to adjust headcount before the quarter is over.
- The plan is set against last year’s cycle time. Early signal: your cycle-time data for senior IC roles in the current quarter is trending 30% higher than the planning assumption. Adjust headcount commitments before the plan defends an unachievable target.
- Recruiter capacity is overestimated. Early signal: cycle times slip across recruiters whose req count exceeded their measured capacity ceiling. The plan adjusts capacity assumptions, or shifts requisitions to recruiters with slack.
- Interviewer load concentrates on a few panelists. Early signal: the same four senior ICs appear on 80% of technical panels in the live book. The plan adds new panelist development as a planning input, not as a reactive fix.
- Feedback lag is the bottleneck, not sourcing. Early signal: median debrief-to-offer-prep gap exceeds two business days. The plan reallocates against the post-interview bottleneck, not the front-of-funnel one.
- Calibration drifts mid-search. Early signal: week-three panel evaluations diverge from the week-one intake brief on the same competency. The plan triggers a re-calibration meeting before the search closes on the wrong spec.
Hiring managers now see our recruiting team as strategic partners rather than people filling roles. When a hire takes longer than expected, everyone understands why, based on the data, which builds trust and sets appropriate expectations.”
The living hiring plan canvas (template)
A practical canvas for standing up the living hiring plan in your TA org. The structure is the same whether you have 5 reqs in flight or 50.
- Section 1 - Goal layer. Quarterly headcount commitments from the business plan, grouped by team and role level. The static part of the plan. Refreshed each quarter, not weekly.
- Section 2 - Role specs. One row per open req with the intake-brief commitments: must-haves, trade-offs, deal-breakers. Sourced from the captured intake notes, not from a separate spec doc.
- Section 3 - Capacity layer. Recruiter-by-recruiter cycle-time data, average days per req per week, and the measured capacity ceiling. Refreshed weekly from interview-corpus data.
- Section 4 - Interviewer load layer. Per-interviewer count across the live book, with a four-panel concentration alert. Refreshed weekly.
- Section 5 - Cycle-time layer. Average days from kickoff to offer by role level. Average days between final round and offer being made. Refreshed weekly with alert thresholds.
- Section 6 - Sourcing yield layer. Channel mix vs. conversion rate per role level. Refreshed weekly.
- Section 7 - Variance dashboard. The current quarter’s plan-vs-actual on hires made, cycle time, and cost-per-hire. The view the TA leader brings to finance.
Run the canvas weekly. The static sections (goal layer, role specs) refresh quarterly. The data layers refresh from the interview corpus. The variance dashboard is the surface you bring to finance.
Bring Metaview into your hiring stack.
Live notes, structured scorecards, and ATS sync - set up in under 10 minutes.
Frequently asked
What is the difference between a hiring plan and a headcount plan?
A headcount plan is the business’s commitment: how many people, at what total cost, by when. A hiring plan is the TA org’s execution against that commitment: which roles, which recruiters, which sources, on which timelines, with which interviewer load. Finance owns the headcount plan; TA owns the hiring plan.
How detailed should a hiring plan be?
Detailed enough that you can defend the cycle-time and capacity assumptions in front of the CFO. Most TA orgs under-invest here. The detail that matters is in the four interview-data layers (cycle time, capacity, interviewer load, feedback lag), not in the role descriptions. If the data layers are precise, the plan defends itself.
Who should own the hiring plan?
The TA leader, with finance as the headcount-target owner and the hiring managers as the role-spec owners. The TA leader is accountable for cycle time, capacity, and yield. The plan is the contract the TA leader signs with the business.
How often should a hiring plan be updated?
The static layers (goals, role specs) refresh quarterly or on a re-org. The data layers (cycle time, capacity, interviewer load, feedback lag, sourcing yield) refresh weekly. That is the difference between a quarterly artifact and a living dashboard.
Can small TA teams benefit from a hiring plan?
Yes. Smaller teams benefit more, not less. The capacity ceiling is tighter, the interviewer load concentrates faster, and a single bad assumption derails the quarter more visibly. The living plan format scales down to a TA team of one without losing structure.
How does Metaview help with hiring planning specifically?
It produces the four data layers (cycle time, recruiter capacity, interviewer load, feedback lag) automatically, from the interviews your team is already running. No separate data-pull workflow; the planning data is a byproduct of the interview corpus.