
Most teams treat the hiring funnel like a leaky pipe. Candidates come in one end, fewer come out the other, and somebody on the team is sure they know which joint is the problem. The diagnosis is almost always wrong. Hiring funnels do not leak randomly. They leak at the joints where two functions hand off to each other and quietly disagree about what good looks like.
Conversion rates are the symptom. The disease lives a layer underneath, in misalignment. In Metaview’s 2026 AI & Hiring Alignment Report, surveying 505 recruiting leaders and hiring managers across North America and EMEA, 90% rated their working relationship with their counterpart as “good or excellent”, and 58% admitted they actively wish they could work around that same counterpart anyway. The contradiction is the funnel. Where the two functions disagree, candidates drop.
This piece is a stage-by-stage diagnostic for TA leaders. We refresh the five conversion rates with 2026 benchmarks, but the goal is not to give you a target number. The goal is to give you a way to read your own funnel like a doctor reads a chart: which leak is upstream of which, which surface in your stack already has the data to diagnose it, and which 30-minute audit you can run Monday morning to find out where you stand.
Why hiring funnels leak (and why most teams misdiagnose)
The standard funnel diagnostic story is wrong in the same way every time. A leader looks at a low conversion rate at, say, hiring-manager screen to onsite, and concludes that the hiring manager is being too picky. The hiring manager looks at the same number and concludes that the recruiter is sending the wrong candidates. Both are reading the same data and arriving at completely different causes. That is the diagnostic problem. Without structured data on what each interviewer was actually evaluating against, the funnel ratio cannot tell you which one of them is right.
The 2026 Alignment Report names the upstream cause. Recruiting leaders and hiring managers do not fully trust each other’s judgment, and a meaningful share of them wish they could work around their counterpart. 90% rate the relationship as good or excellent. 58% actively wish they could bypass their counterpart. That contradiction is not a soft-skills problem. It is the structural cause of every funnel leak. When two functions evaluate against subtly different rubrics, the candidate that passes one fails the other, and the conversion rate drops at the handoff.
The funnel data alone cannot fix this. Knowing your hiring-manager-screen-to-onsite ratio is 38% tells you a leak exists. It does not tell you whether the leak is the recruiter sourcing the wrong profile (upstream), the hiring manager evaluating against a different rubric than the recruiter (alignment), or the role itself being underspecified (intake). Teams that fix funnels separate those three causes before they touch the number. Teams that do not fix funnels argue about whose fault the 38% is, change nothing structural, and watch it stay at 38% next quarter.
The five conversion rates and their 2026 benchmarks
The five rates have not changed since the original framework. The benchmarks have. The biggest shift sits at the inbound stage, where the AI-generated application surge has compressed Stage 1 conversion to a fraction of its 2022 level on roles with high LinkedIn visibility. The second-biggest shift sits at Stage 5, where candidate-side ChatGPT-assisted comparison shopping has tightened acceptance windows by days.
Treat the table below as orientation, not a target. The right ratio for your team is the one that holds steady (or trends down) across quarters at consistent quality. A stage rate that moves 20 points quarter over quarter on the same role family is the diagnostic signal, not the absolute level.
| Stage | 2026 target | Healthy pattern | Where it leaks first |
|---|---|---|---|
| Inbound to recruiter screen | 1% to 3% (post-filter) | Conversion holds steady against vetted applications, not raw inbound volume. | Filter is missing. The recruiter is reading AI-generated noise instead of the residual real candidates. |
| Recruiter screen to HM screen | 60% to 80% | Ratio steady week to week; rejection reasons tag to specific competencies on the rubric. | Intake spec drifted. The recruiter is screening against last month’s rubric while the HM updated theirs. |
| HM screen to onsite | 30% to 50% | First few screens calibrate the spec, then the rate stabilizes for the rest of the search. | Hiring manager is evaluating against a different rubric than the recruiter screened on. |
| Onsite to offer | 30% to 50% | Panel scores cluster within one point on each competency; debriefs start from captured signal. | Interviewers disagree with each other. No structured rubric, no shared signal, no clean offer call. |
| Offer to accept | 70% to 90% | Acceptance trends up over the search, not down; declined offers cluster on a known reason. | Candidate sensed misalignment in the process and repriced the offer as compensation. |
Stage 1: Inbound applicant to recruiter screen
This is the stage that broke between 2023 and 2026. Three years ago, a 3% to 6% applicant-to-screen rate was the working benchmark for a healthy job board on a generalist role. In 2026, that same rate hovers between 1% and 3% on roles with high LinkedIn visibility, because the inbound surge is largely AI-generated applications, duplicate accounts, and résumé farms. The denominator is contaminated, so the ratio is not telling you what it used to.
The leak at this stage is not that recruiters are filtering too aggressively. The leak is that the volume hides the signal. When a recruiter sees 2,000 applications for one req, the work shifts from “find the best 50” to “drop the worst 1,800”. Different work, different ratio, different failure mode.
The fix is at the filter, not at the screen. If the filter strips out the AI-generated applications, duplicate accounts, and obvious mis-fits cleanly, the residual conversion rate to screen recovers to close to its pre-2023 level on a smaller, real denominator. If the filter is “the recruiter eyeballs each résumé”, the rate collapses because the work does not scale and the recruiter burns the day before they ever get to the candidates worth a real read.
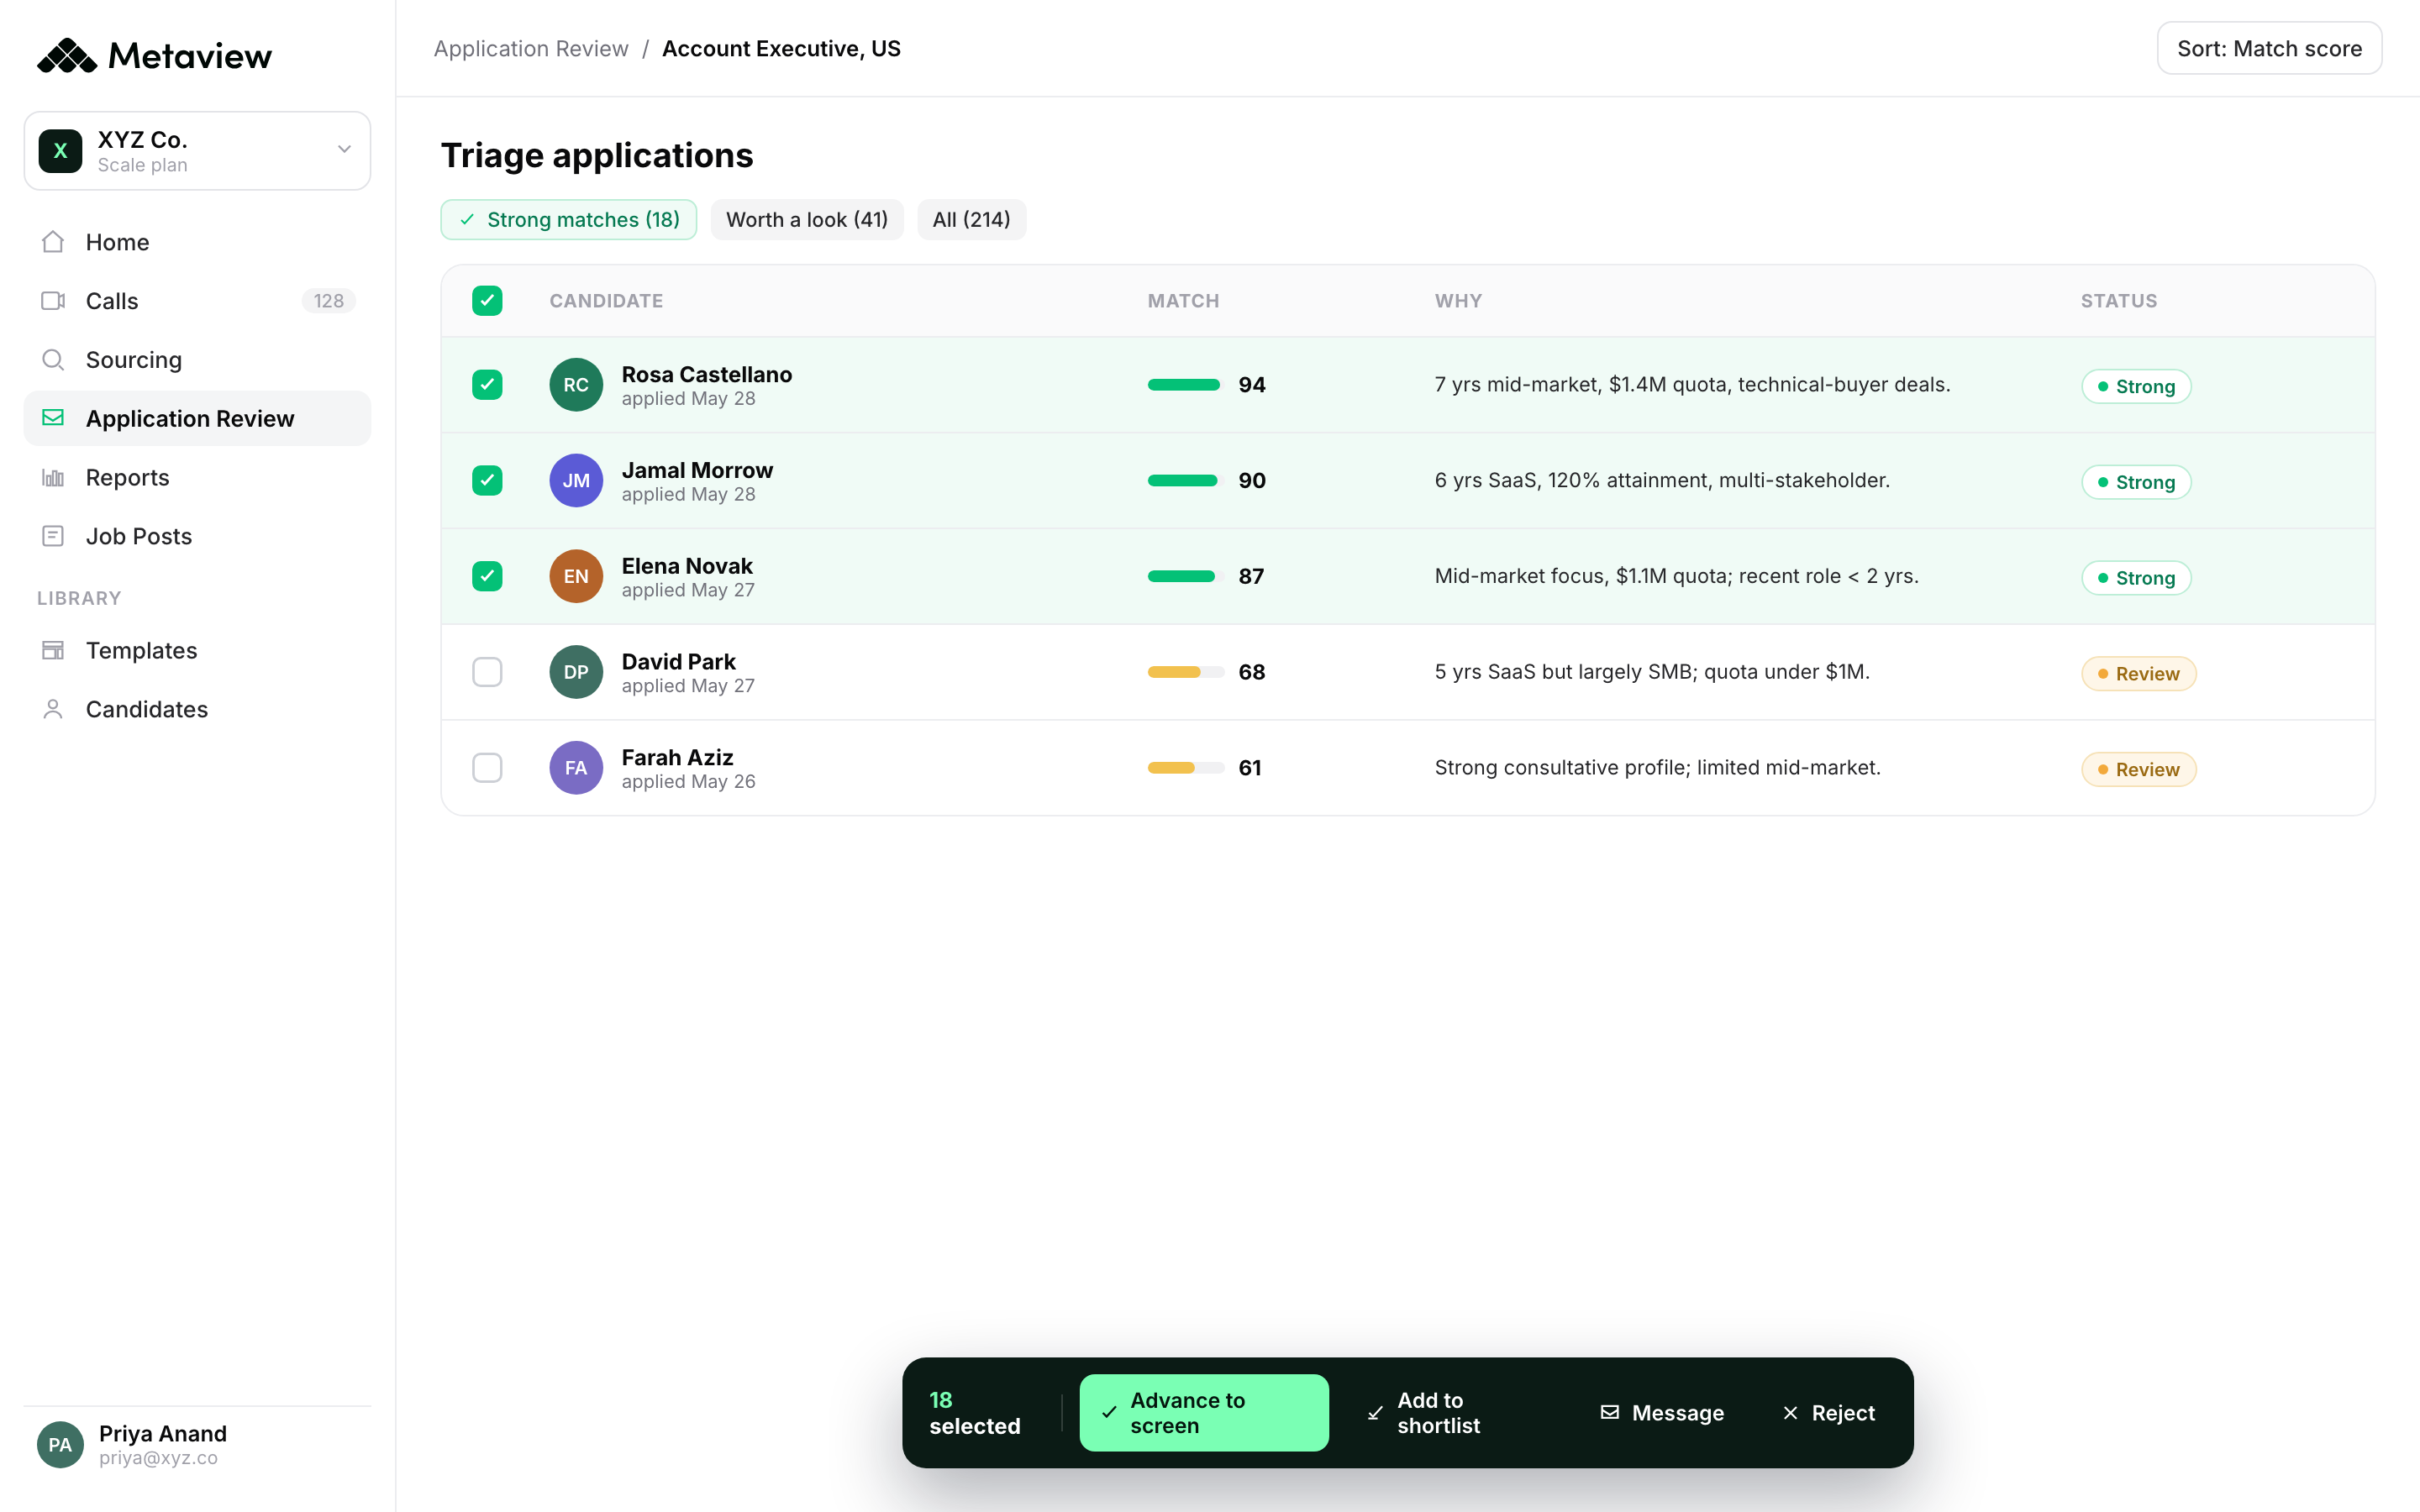
- 1AI-generated detection flag. Surfaces résumés whose language patterns match generative output. Strips the noise from the denominator before the conversion-rate math runs.
- 2Duplicate-account flag. Catches the same email, phone, or device across multiple applications to the same req. Counts once in the funnel, not five times.
- 3ICP fit score. The recruiter sees the structured fit signal before they open the résumé. Stage 1 decisions move from 90 seconds to roughly 5, and the residual queue is the candidates who actually warrant a read.
Stage 2: Recruiter screen to hiring-manager screen
This is the most diagnostic stage in the funnel. A consistent ratio above 75% means the recruiter and the hiring manager are well calibrated. The recruiter’s screen is predictive of what the hiring manager would say next. A ratio that swings between 40% and 90% from week to week on the same role means the rubric is unstable. The candidate the recruiter waves through this week is the one the hiring manager rejects on sight next week.
The fix is not at the recruiter screen. The fix is at intake. If the rubric the recruiter is screening against in week four is the same one the hiring manager committed to in week one, the conversion stabilizes. If the rubric has drifted (the hiring manager has seen a few candidates and updated their internal mental model without telling anyone), the recruiter is screening against yesterday’s spec while the hiring manager is evaluating against today’s.
How many times have we heard hiring managers say there’s not enough activity? Being able to articulate the process, the role, the time-in-step, closes the absence of communication. Hiring managers conflate activity with progress.”
Stage 3: Hiring-manager screen to onsite
Stage 3 is where intake debt comes due. A candidate the hiring manager liked enough to do a screen but not enough to send to the panel is almost always a candidate the hiring manager and recruiter never aligned on in the first place. The 30-minute screen is the first time the hiring manager sees a real person against the spec they signed off on three weeks ago. Frequently, that real exposure is when they realize the spec was wrong.
Teams that run Stage 3 well do one thing differently. They treat the first 3 to 5 hiring-manager screens as calibration interviews, not gating decisions. The hiring manager still says yes or no, but every screen feeds back into the spec. By candidate 5, the spec is what the hiring manager would actually approve, and Stage 3 conversion stabilizes for the rest of the search. Without that calibration loop, every screen is a one-off, and the conversion stays unstable for the life of the requisition.
 Anastasia Vihodtev
Stages 4 and 5: Onsite to offer, offer to accept
By Stage 4, the leak is almost never about the candidate. It is about the panel disagreeing with each other. If three interviewers gave the same candidate a 4 out of 5, a 2 out of 5, and a 5 out of 5 on the same competency, the offer either does not happen or happens reluctantly. The fix is structured capture: every interviewer evaluates against the same rubric, every score traces to a competency, every panel debrief starts from the same set of signals instead of from four different memories of what the candidate said.
Stage 5 (offer to accept) is where every upstream leak finally gets repriced as compensation. Candidates who felt aligned with the company through the process accept at 80% to 90%. Candidates who felt evaluated by four people who clearly had not talked to each other accept at 50% to 60%, and the offer-to-accept ratio becomes the leading indicator of what next quarter’s bar will look like, because every “no” candidate goes back into the market and tells the next employer how your panel actually ran.
It’s reduced my screening time by up to 50%. Both strong and weak profiles are reviewed within a couple of seconds.”
The 30-minute funnel audit you can run Monday morning
The audit costs nothing and is not a meeting. Pull last quarter’s funnel data from your ATS. Segment by stage, source, and recruiter. Look at the four diagnostics below. Three of them will be fine. The fourth one is where your funnel is actually leaking.

Is your inbound volume concentrated in one channel? A Stage 1 conversion that crashed after 2023 usually traces to a sourcing channel saturated with AI-generated noise, not a recruiter-quality issue.

Are your Stage 1 rejection reasons tagged to specific signal (fraud, AI-generated, ICP miss), or just “no”? Tagged rejections are diagnosable. Untagged ones can only be counted.

Are Stage 2 and Stage 3 rejection reasons tagged to specific competencies on the rubric? If they live as free-text “not a fit” notes, you can count the leak but not diagnose it.

Does your Stage 3 to Stage 4 conversion swing more than 15 points quarter over quarter on the same role family? Variance is the diagnostic. Absolute levels are noise.
Whichever card flags first is the upstream cause of your funnel problem. The fix is the surface in that card. The other three will stabilize on their own once the actual cause is addressed. Audit on Monday, scope the fix on Tuesday, ship it by end of week, and watch the funnel re-stabilize over the following 30 to 60 days. The compounding effect of fixing the actual cause (versus tweaking the symptom stage) is what separates teams that hit their hiring goals from teams that argue about the 38% three quarters in a row.
See how the live capture and auto-scorecard flow works on a real interview.
Frequently asked
What is a “good” conversion rate at each stage?
There is no universal absolute. The right rate depends on role seniority, source mix, and your team’s decision threshold. The pattern that matters is whether the rate holds steady at consistent quality across quarters, not the level itself. A consistently low rate often means your spec is genuinely tight, which is a feature, not a bug. A rate that swings 20 points quarter over quarter is the actual diagnostic signal.
Which conversion rate should I fix first?
The one with the biggest quarter-over-quarter variance, not the one with the lowest absolute level. Variance signals an unstable upstream cause. A consistently low rate often reflects an intentionally tight spec. A consistently high rate with no variance is probably fine. A rate that bounces around 20 points on the same role family is almost always intake debt that has not been paid yet.
My Stage 1 conversion crashed after 2023. Is that my fault?
Almost certainly not. The denominator has changed. AI-generated applications, résumé farms, and duplicate accounts have contaminated inbound volume on every public-facing role. The right metric to track now is conversion against vetted applications (after a fraud and AI-generated filter), not raw applications. Comparing your 2026 raw-application ratio to your 2022 raw-application ratio is comparing two different denominators.
How do I know if my Stage 2 leak is a recruiter problem or an intake problem?
Look at week-over-week variance on the recruiter-screen-to-HM-screen rate. If the variance is high, the rubric is unstable and the leak is intake. If variance is low but the absolute number is also low, you have a recruiter calibration or sourcing problem. If both variance and absolute are low and stable, you have a hiring-manager-bar question to escalate, not a funnel leak to fix.
What is the single fastest fix I can make this quarter?
Structured rejection reasons. If every rejection at every stage is tagged to a specific competency from the rubric, you can diagnose your funnel in 30 minutes instead of 30 days. Free-text “not a fit” is the diagnostic equivalent of saying “I don’t feel well” to a doctor: true, but useless.
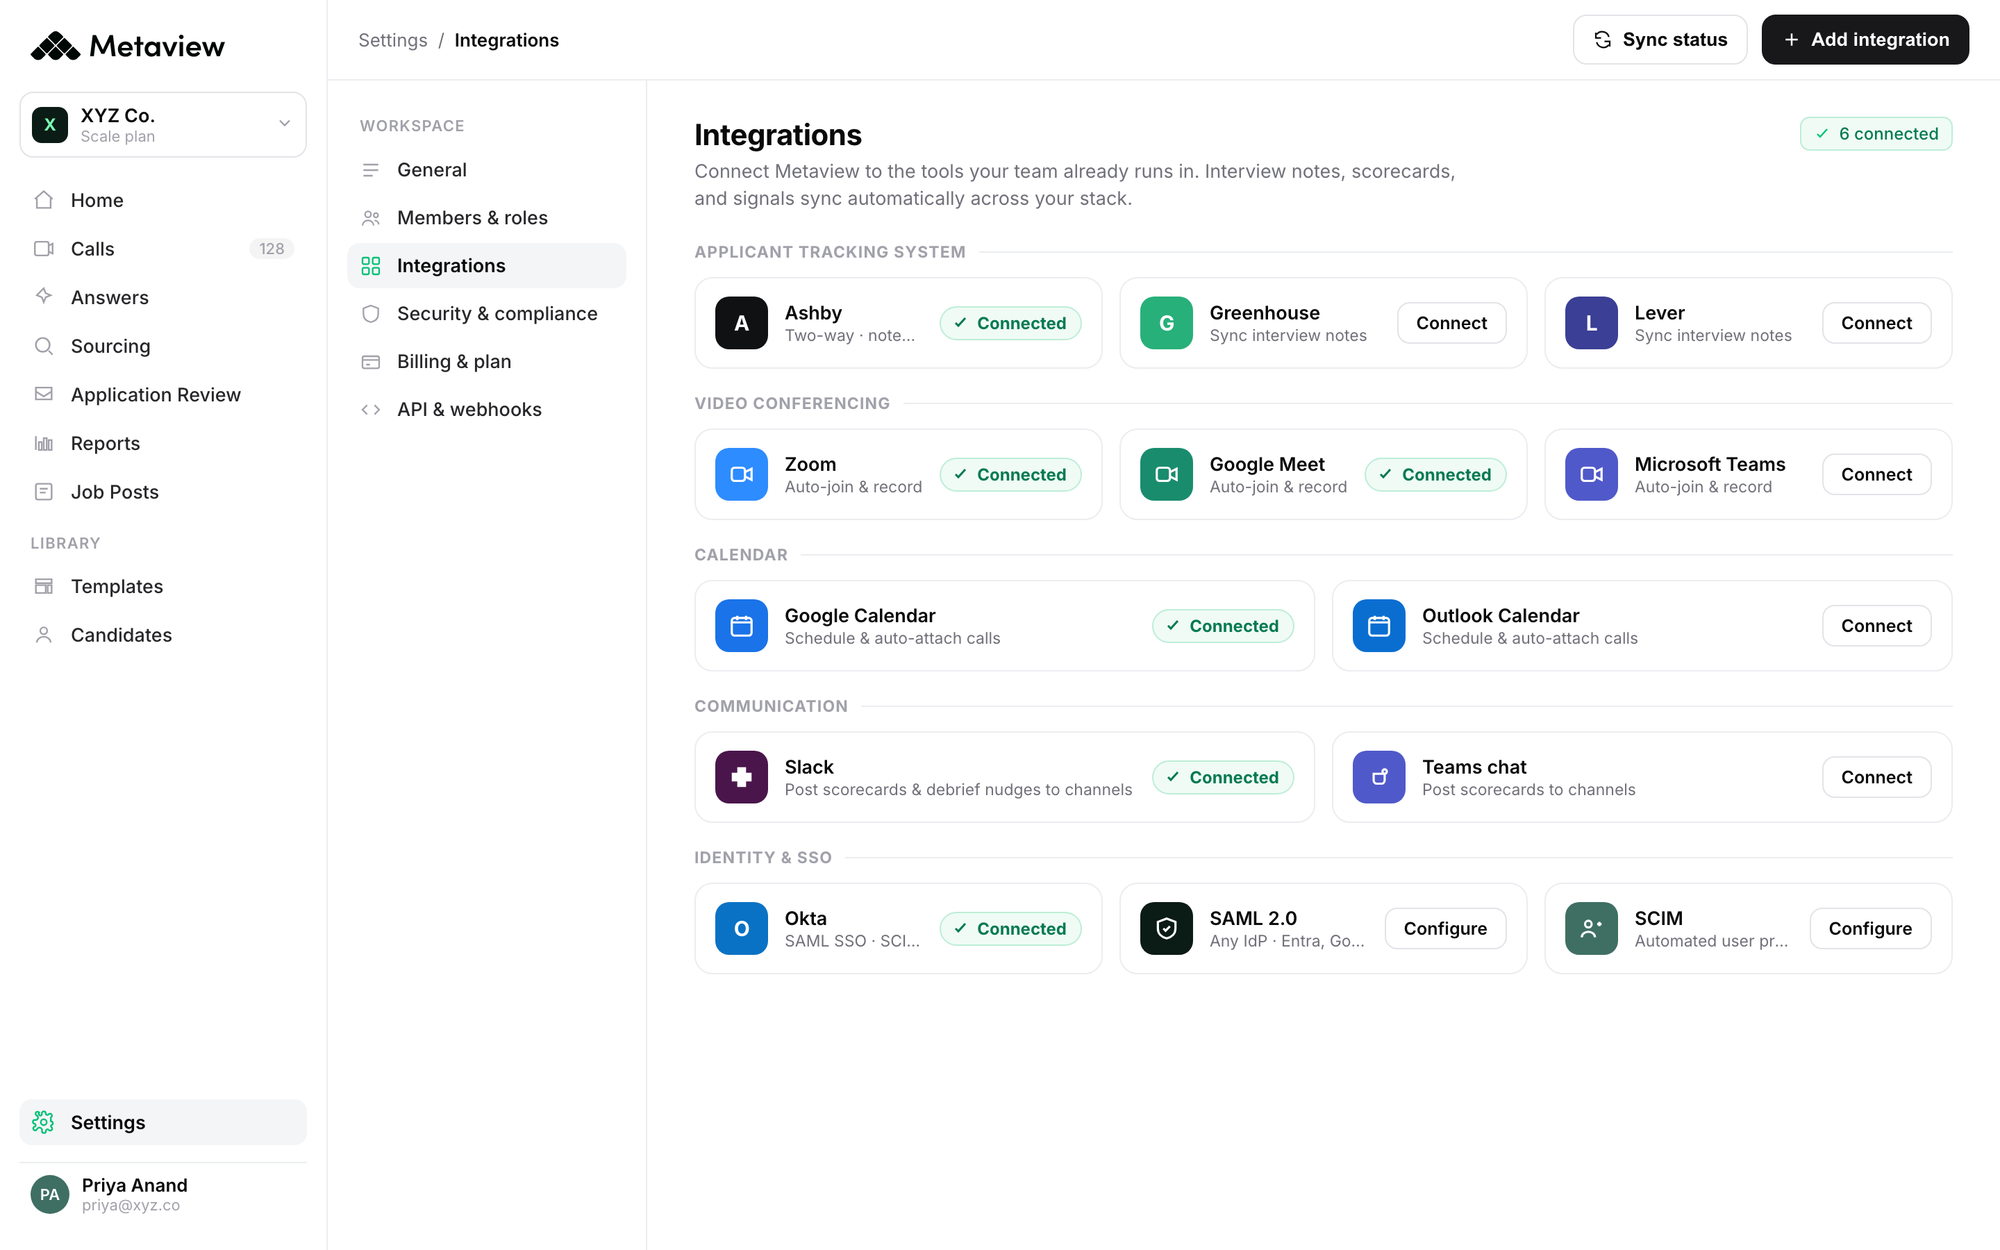
Does Metaview replace my ATS funnel reports?
No. Metaview captures the interview itself, so the rejection reasons and scoring against the rubric flow back into your ATS reports as structured signal. The funnel data still lives in your ATS. Metaview makes it diagnosable instead of countable.