
Most recruiting dashboards show the wrong numbers.
Time-to-fill, candidates added, requisitions open. Vanity metrics that make the function look busy without telling leadership whether the team is actually getting better at hiring.
The 12 metrics below are the ones that move offers, retention, and confidence in the recruiting function. Each one tells you something you can't get from the requisition count alone.
All 12 metrics at a glance
| # | Metric | Bucket | Healthy benchmark |
|---|---|---|---|
| 1 | Time to fill | Pipeline efficiency | Role-dependent; trend matters more |
| 2 | Time to hire | Pipeline efficiency | 21-45 days for IC roles |
| 3 | Time to feedback | Pipeline efficiency | Under 24 hours; best-in-class 10-20 min |
| 4 | Offer acceptance rate | Decision quality | 85-90% on strong teams |
| 5 | Interview-to-offer ratio | Decision quality | 3:1 to 5:1 depending on role |
| 6 | Cost per hire | Pipeline efficiency | Watch trend; absolute varies by role |
| 7 | Quality of hire by source | Post-hire outcomes | Compare per channel quarterly |
| 8 | Interviewer consistency | Decision quality | Score variance under 1.5 on a 5-point scale |
| 9 | Candidate experience score | Decision quality | 4.2/5 on post-process survey |
| 10 | Diversity flow by stage | Pipeline efficiency | Track stage-to-stage drop, not just applicant |
| 11 | New-hire retention | Post-hire outcomes | 90% at 12 months; 80% at 24 months |
| 12 | Hiring manager satisfaction | Decision quality | 4/5 on quarterly survey |
1. Time to fill
What it measures: calendar days from req opening to accepted offer.
Why it matters: the universal KPI executives ask for. It tells the business how fast the team converts open headcount into hires.
How to move it: instrument the funnel stage by stage so you can see where time actually goes. Almost always, the bottleneck is downstream (time-to-feedback, debrief delay) rather than upstream.
2. Time to hire
What it measures: days from first candidate contact to accepted offer.
Why it matters: a cleaner signal than time-to-fill because it excludes req-launch delay. It isolates the team's velocity once they're working on the candidate.
How to move it: shorten the gap between stages. Same-day or next-day scheduling between recruiter screen and hiring-manager round usually cuts a week.
3. Time to feedback
What it measures: gap between interview end and structured feedback landing in the ATS.
Why it matters: a metric few teams track, and one that pays off when they do. Days lost here compound into time-to-hire, candidate ghosting, and offer-acceptance losses.
We're using Metaview to create stronger hiring signals, better calibration across interviewers, and a really high-quality experience for candidates as well, regardless of the interviewer.”
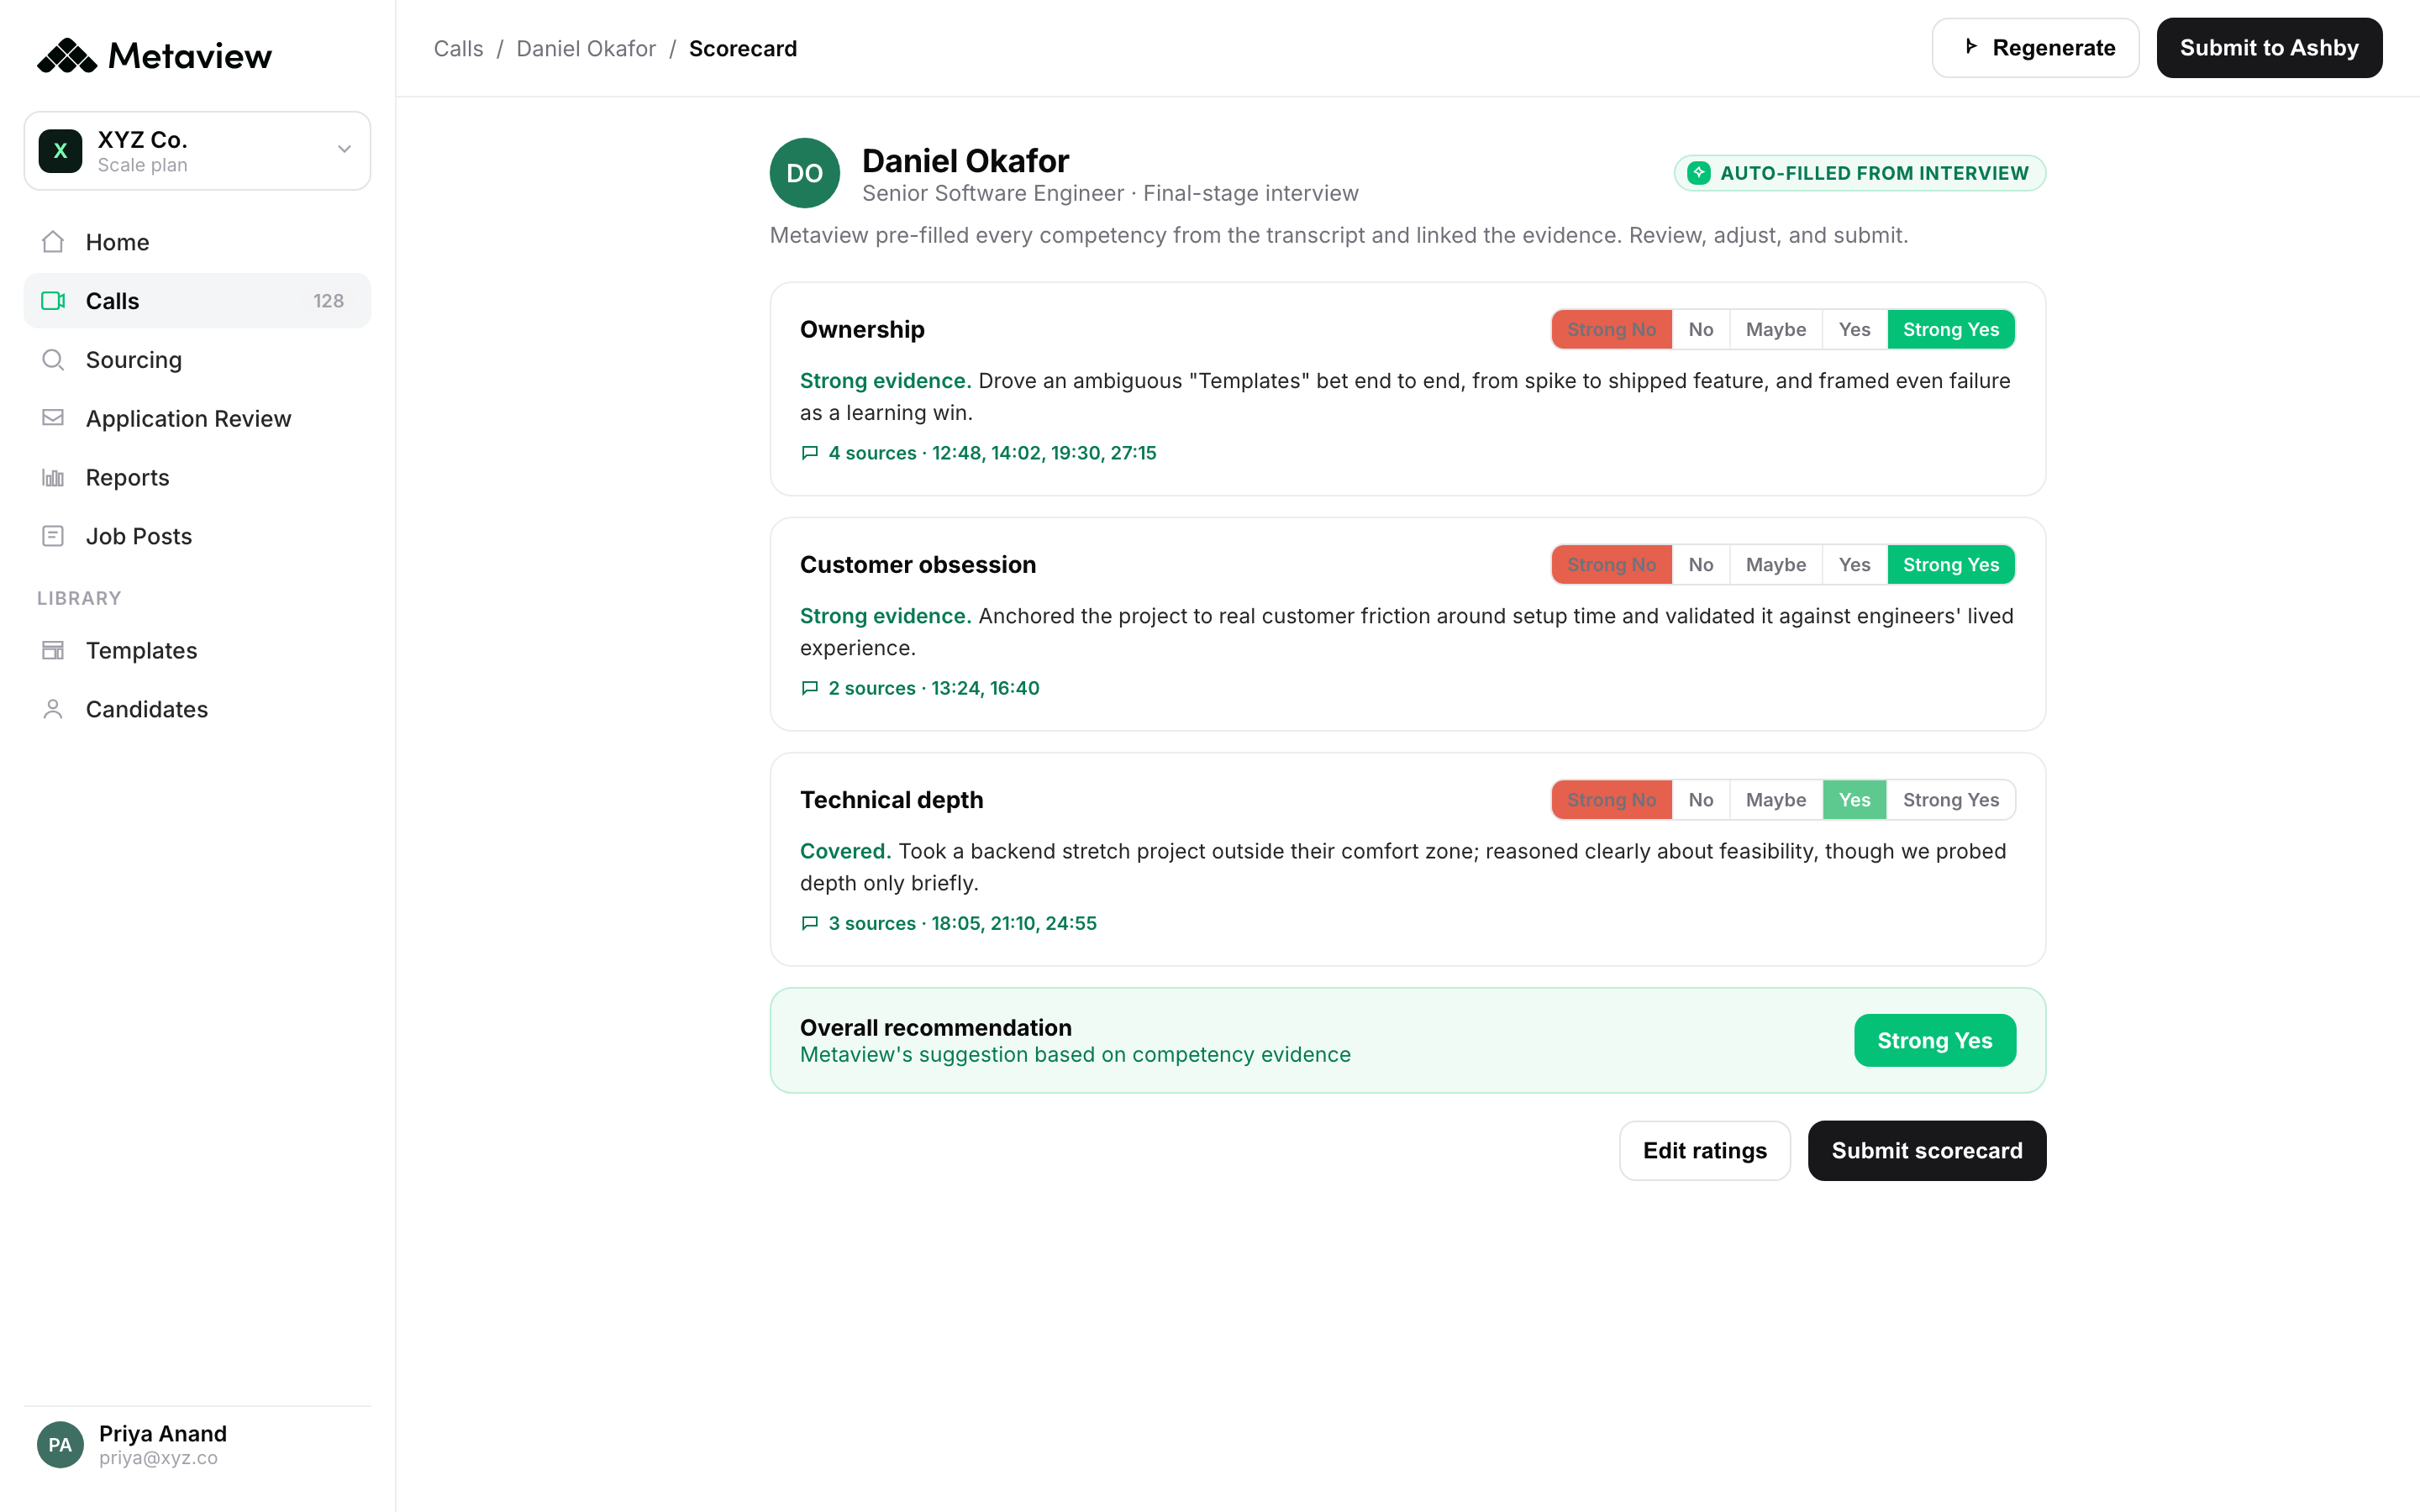
How to move it: capture the interview structurally so the scorecard is pre-populated. Hiring managers fill in a partial scorecard faster than a blank one.
4. Offer acceptance rate
What it measures: percentage of issued offers that get signed.
Why it matters: a low rate is almost never just a compensation problem. Usually it's a candidate-experience or feedback-speed problem dressed up as one.
How to move it: shorten time-to-feedback (metric 3), brief interviewers on the candidate before each round, and make the close feel proactive. Strong teams close 85-90%.
5. Interview-to-offer ratio
What it measures: number of candidates interviewed per offer issued.
Why it matters: the indicator of sourcing quality and rubric calibration. Above 8:1 you're sourcing the wrong shape; below 2:1 you're under-evaluating.
How to move it: calibrate the brief with the hiring manager before sourcing. Most ratios outside the healthy range trace to misalignment at intake.
6. Cost per hire
What it measures: total spend (tools, ads, agency fees, recruiter time) divided by hires made.
Why it matters: absolute varies wildly by role, so the trend is what matters. A flat cost with rising quality is a real win; falling cost with falling quality is a problem dressed as a result.
How to move it: automate the high-volume, low-judgment work first. Recruiter time concentrated on late-funnel candidate calls drives acceptance more than any sourcing dollar.
7. Quality of hire by source
What it measures: retention and performance segmented by where the hire came from.
Why it matters: referred hires often stay twice as long as job-board hires. Tracking this surfaces which channels deserve disproportionate budget.
How to move it: tag every candidate with source-of-hire on day one. Review quarterly. Cut the worst-performing channel for a quarter and watch what happens.
8. Interviewer consistency
What it measures: variance in scores given by different interviewers to the same candidate (or comparable candidates).
Why it matters: the metric most teams don't have. High variance means your hiring decisions are partly a coin flip based on who interviewed.
How to move it: standardize the question set per competency, use structured scorecards with behavioral anchors, and run calibration sessions quarterly.
9. Candidate experience score
What it measures: post-process survey rating from candidates including rejects.
Why it matters: the experience your rejected candidates had is the brand they describe. Today's rejected candidate is tomorrow's referrer or hire.
How to move it: survey every candidate. The honest signal usually comes from the ones you didn't hire. 4.2/5 or higher on a post-process survey is the healthy range.
10. Diversity flow by stage
What it measures: demographic representation at each pipeline stage.
Why it matters: tracking applicant-level diversity hides where pipelines actually drop. The drop usually happens at hiring-manager interview or final round, not at top of funnel.
How to move it: instrument stage-to-stage flow, not just applicant pool. Address the largest drop first; the rest usually follows.
11. New-hire retention
What it measures: percentage of new hires still employed at 6, 12, and 24 months.
Why it matters: one of the few post-hire metrics that shows whether the recruiting process is working. Speed and acceptance are worthless if the hire leaves at month 9.
How to move it: compare retention by sourcing channel and by interviewer. The patterns surface fast. Strong teams hit 90% at 12 months and 80% at 24 months.
12. Hiring manager satisfaction
What it measures: hiring manager rating of the recruiting partnership on a quarterly survey.
Why it matters: it predicts the strategic health of recruiting better than time-to-fill does. Dissatisfied hiring managers compensate by going outside the process; satisfied ones bring you into workforce planning earlier.
How to move it: run quarterly check-ins, share quality-of-hire data per manager, and treat the recruiter-HM relationship as a product. 4/5 on a quarterly survey is the healthy range.
How to build the dashboard
Most teams that try to track 12 metrics end up tracking none of them carefully.
Start with three: time-to-feedback, offer acceptance rate, and quality of hire by source. Together they tell you whether the pipeline runs, whether the decision converts, and whether the source produces keepers.
Review weekly for pipeline metrics, quarterly for outcome metrics. Most teams discover the bottleneck isn't where they thought.
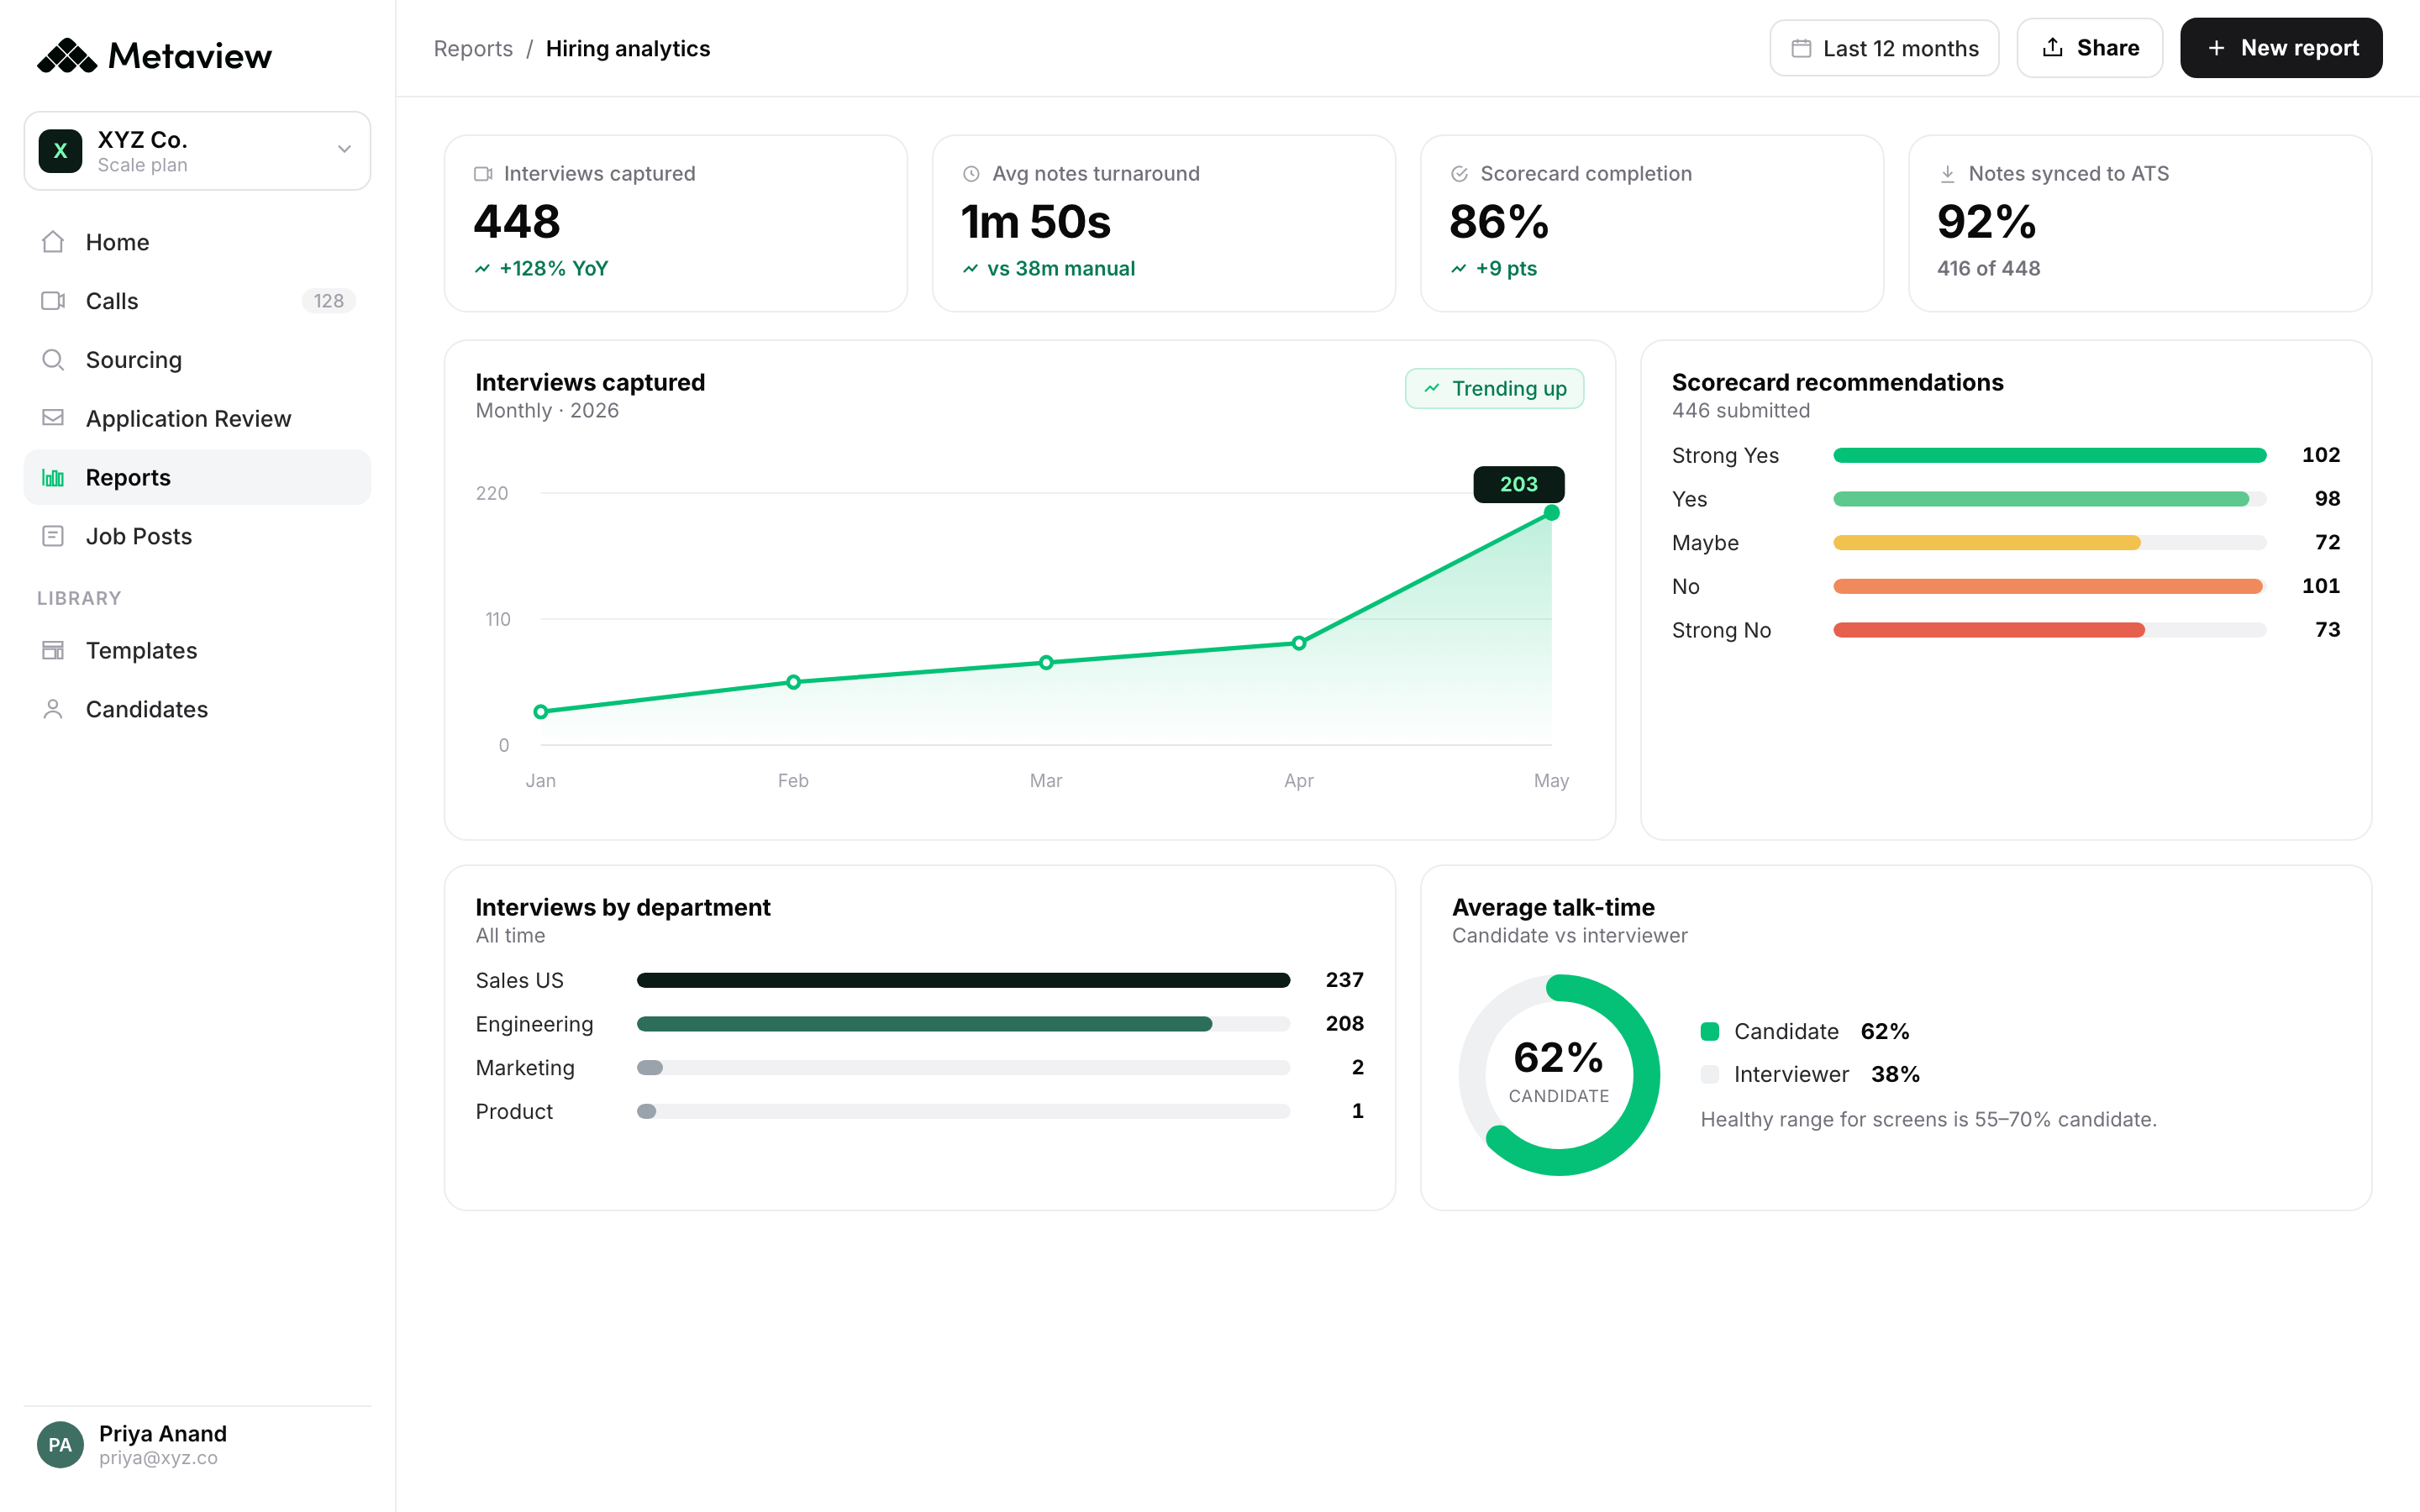
Metaview captures the interview, structures the scorecard, and writes back to your ATS automatically. The data behind most of these metrics (time-to-feedback, interviewer consistency, candidate-experience signal) becomes available without spreadsheet work.
4,000+ organizations run hiring on Metaview, including SoSafe, Brex, emnify, Quora, Workleap, Catawiki, Robinhood, and Automattic.
Bring Metaview into your hiring stack.
Live notes, structured scorecards, and ATS sync, set up in under 10 minutes.
Frequently asked
Which recruiting metric should I start with?
Time to feedback. Most teams ignore it, it's the largest source of avoidable delay, and fixing it cascades into time-to-hire, candidate experience, and offer acceptance.
What's the difference between time to fill and time to hire?
Time to fill includes the gap before sourcing starts. Time to hire excludes it. Time to hire is the cleaner signal of recruiting velocity once the team is working on the candidate.
What's a healthy offer acceptance rate?
85-90% on strong teams. Below 75% is a candidate-experience or feedback-speed problem in most cases; below 60% usually means the team is over-issuing to candidates who haven't really committed.
How do I measure quality of hire?
Combine 6- and 12-month retention with hiring-manager-rated performance at 90 days. Segment by sourcing channel and by interviewer to surface where keepers come from.
How often should I review recruiting metrics?
Pipeline metrics weekly, decision-quality metrics monthly, post-hire outcome metrics quarterly. Reviewing outcome metrics too often invites noise; reviewing pipeline metrics too rarely lets problems compound.
Do small teams need recruiting analytics?
Yes. Smaller teams have less margin for waste, which makes the few metrics they pick disproportionately important. Three metrics done well beats 12 metrics done sloppily.