
It is 8:47 on a Tuesday. The dashboard says your application completion rate dropped four points last week, and the standard advice is already loaded in every recruiter blog you opened: shorten the form, cut the cover letter, kill the account creation, lose the long-tail demographic questions. That advice is not wrong. It is just half the job.
The completion rate metric measures one thing: how many people who hit your apply page made it to the submit button. It is a clean diagnostic of pre-submit friction. What it cannot tell you is what happens on the other side of submit. A 25% completion rate that lands 80 noisy applications in your inbox is not obviously better than a 12% rate that lands 38 strong-fit ones. Most teams optimize the metric in isolation and end up with the inverse problem of the one they started with.
This guide does the boring math first. The formula, the benchmarks people actually hit, the five friction points that drive most of the drop. Then it covers the part nobody wants to talk about: the cost of shortening your way into a noisier inbox, and the two-layer fix (a lightweight form plus an AI triage layer downstream) that actually moves a TOFU funnel without moving the leak to a different stage. By the end of it you should have a 14-day audit you can run on your own roles.
What completion rate measures (and what it doesn't)
Application completion rate is the percentage of candidates who started an application and reached the submit confirmation page. It is a TOFU funnel metric, sitting upstream of every other recruiting number you care about. It is also one of the few metrics in hiring that you can move with a two-hour Tuesday and a job-board admin password.
Here is what completion rate does not measure. It does not measure quality. It does not measure whether the people who completed are the people you want. It does not measure how many of the completers are using generative AI to mass-apply across 400 roles a day. It does not measure whether your downstream review process can absorb the extra volume without dropping great-fit candidates between recruiter logins. A rising completion rate is a good thing only if everything underneath it can keep up.
The framing matters because of what the survey data says about the cost of slow inbound handling. According to Metaview's 2026 AI & Hiring Alignment Report, surveying 505 recruiting leaders and hiring managers across North America and EMEA, 67% of teams lose qualified candidates to competitors who move faster every single month. The drop is not at apply, it is in the gap between apply and first response. That gap is the part completion-rate optimization on its own does not touch.
The whole way we would take in applicants was based on something that was essentially connected to the fact this used to be a piece of paper. The generation coming up now will rethink that entirely.”
The formula, the benchmarks, the math
Strip out the marketing and the metric is one line of arithmetic. Completion rate = completed applications ÷ started applications × 100. What people argue about is what counts as a start (page view, first field filled, login attempt) and what counts as a completion (submit, payment, ATS-confirmed). Pick a definition and hold it constant. The trend matters more than the absolute number.
The basic formula
Most ATS dashboards count a start when the candidate begins filling a field on the application form. They count a completion when the submit endpoint fires successfully. If your ATS counts page views as starts, your completion rate is going to look worse than your peers because you are dividing by a noisier denominator. Check the definition before you panic about a number.
What good looks like, by role type
Public benchmarks for completion rate vary wildly because they are averaged across role types that should not be in the same bucket. A hiring-manager-led panel application for a Director of Engineering is not the same artifact as a one-tap mobile apply for a customer-service associate in a frontline retail org. Useful rule of thumb: high-friction white-collar roles converge around 10 to 20%. Low-friction frontline roles converge around 30 to 50%. Above that, you are almost certainly not collecting the signal you need to triage.
Why aggregated benchmarks lie
Benchmarks lie because the denominators are inconsistent and the publishers want to sell you something. A 35% global average is interesting trivia. The number that matters is yours, measured month-over-month, broken out by role type and source. Anything else is comparing your inbound funnel to somebody else's marketing copy.
What to measure alongside it
Completion rate without three sibling metrics is a vanity number. Measure: (1) time from submit to first recruiter touch, (2) recruiter screen pass rate per source, and (3) AI-flag rate per source. A completion rate that climbs while pass rate falls means you bought your apply-page lift by buying noise. The trade-off lives in the sibling metrics, not in the headline.
The 5 friction points behind most drop-off
Most application-page abandonment traces to one of five things. They show up in different proportions for different roles, but they are almost always the leak. If you are running a completion-rate audit, start here before you spin up an A/B test for button color.
1. Form length and re-entry
Every field past the first six measurably moves drop-off. The worst version is the upload-and-retype: the candidate uploads a resume, then the form asks them to retype the same employment history into a structured grid. That single pattern accounts for more abandonment than any other single thing on apply pages, and the fix is one ATS config flag away in every modern system.
2. Account-creation walls
Forcing an account before submit (sign up to apply, confirm email to save your progress) is a conversion-killer your engineers tolerate because nobody owns the metric they break. Mobile drop-off after a verification-email step is often 40% or worse. Move account creation to post-submit, after the candidate is committed.
3. Stage-gated assessments
A 40-minute technical assessment embedded inside the apply flow looks like a quality filter. It is a quality filter in reverse: the candidates who power through are not necessarily the strongest, they are the ones who happened to have a free Saturday afternoon. Strong passive candidates with current roles abandon immediately. Move the assessment to post-screen.
4. Demographic and EEO questions in the wrong place
Compliance questions belong on the form. The problem is when they sit between basic info and submit, with no progress indicator, no explanation of why they are being asked, and no opt-out. Compliance questions belong at the very end of the flow, after the submit-completion has already fired in the candidate's head.
5. Post-submit silence
This one does not show up in completion-rate dashboards because the candidate already submitted. It shows up in the next month's funnel as interview-attendance drop, ghosting, and offer-decline rate. Most teams send a templated acknowledgement and then go silent for 11 days. The candidates with options take the first offer they hear from a team that moved on day two.
The hidden cost of shortening your form
Here is the dynamic nobody covers in the standard completion-rate post. Friction at apply was doing two jobs: it was losing you candidates, and it was acting as a crude filter. Strip the friction and you keep more of the candidates. You also keep more of the noise: mass-apply bots, AI-generated resumes pointed at every role on Indeed, candidates who applied to 240 things this week and have no recollection of yours by Thursday.
The fix-only-the-form team optimizes the metric and then drowns. The two-layer team optimizes the form AND adds a triage layer that does the job the friction used to do, except with signal instead of friction. Same completion-rate lift, very different downstream funnel.
- Completion rate climbs 8 to 15 points.
- Recruiter inbox volume climbs 30 to 60%.
- Time-to-first-response gets worse, not better.
- Recruiter screen pass rate falls.
- Six months later, attrition ticks up on the cohort.
- Same completion-rate lift.
- Inbound noise is auto-bucketed before a recruiter touches it.
- Time-to-first-response on high-fit candidates drops to hours.
- Recruiter screen pass rate holds or climbs.
- Attrition cohort holds. You actually keep the hires.
The two-layer fix: lighter form, smarter review
The two-layer pattern is not new. It is what high-volume retail and hospitality teams have done with applicant-tracking layers for years, and what scaled tech teams started doing with AI-fit scoring once GPT-class models got reliable enough to bucket candidates without hallucinating credentials. The novelty is not the pattern, it is that the second layer is finally good enough for white-collar TOFU.
Layer one is the form. Cut every field that does not gate a yes-or-no screening decision. Move account creation, assessments, and demographics to post-submit. Audit on mobile first because that is where most of the drop happens. If you do this and nothing else, you will see the completion-rate lift inside two weeks.
Layer two is the triage layer at review. The job of this layer is to read every inbound application against an explicit ICP, score it, flag the automated-apply and AI-generated submissions, and surface the high-fit candidates fast enough that a recruiter can respond the same day. Without layer two, layer one creates an inbox problem that wipes out the candidate-experience gains you bought with the form cuts.
Everyone is trying to go faster on time-to-hire. Great. You're probably also fastest to attrition. Probably not great.”
How Metaview's Application Review handles the volume
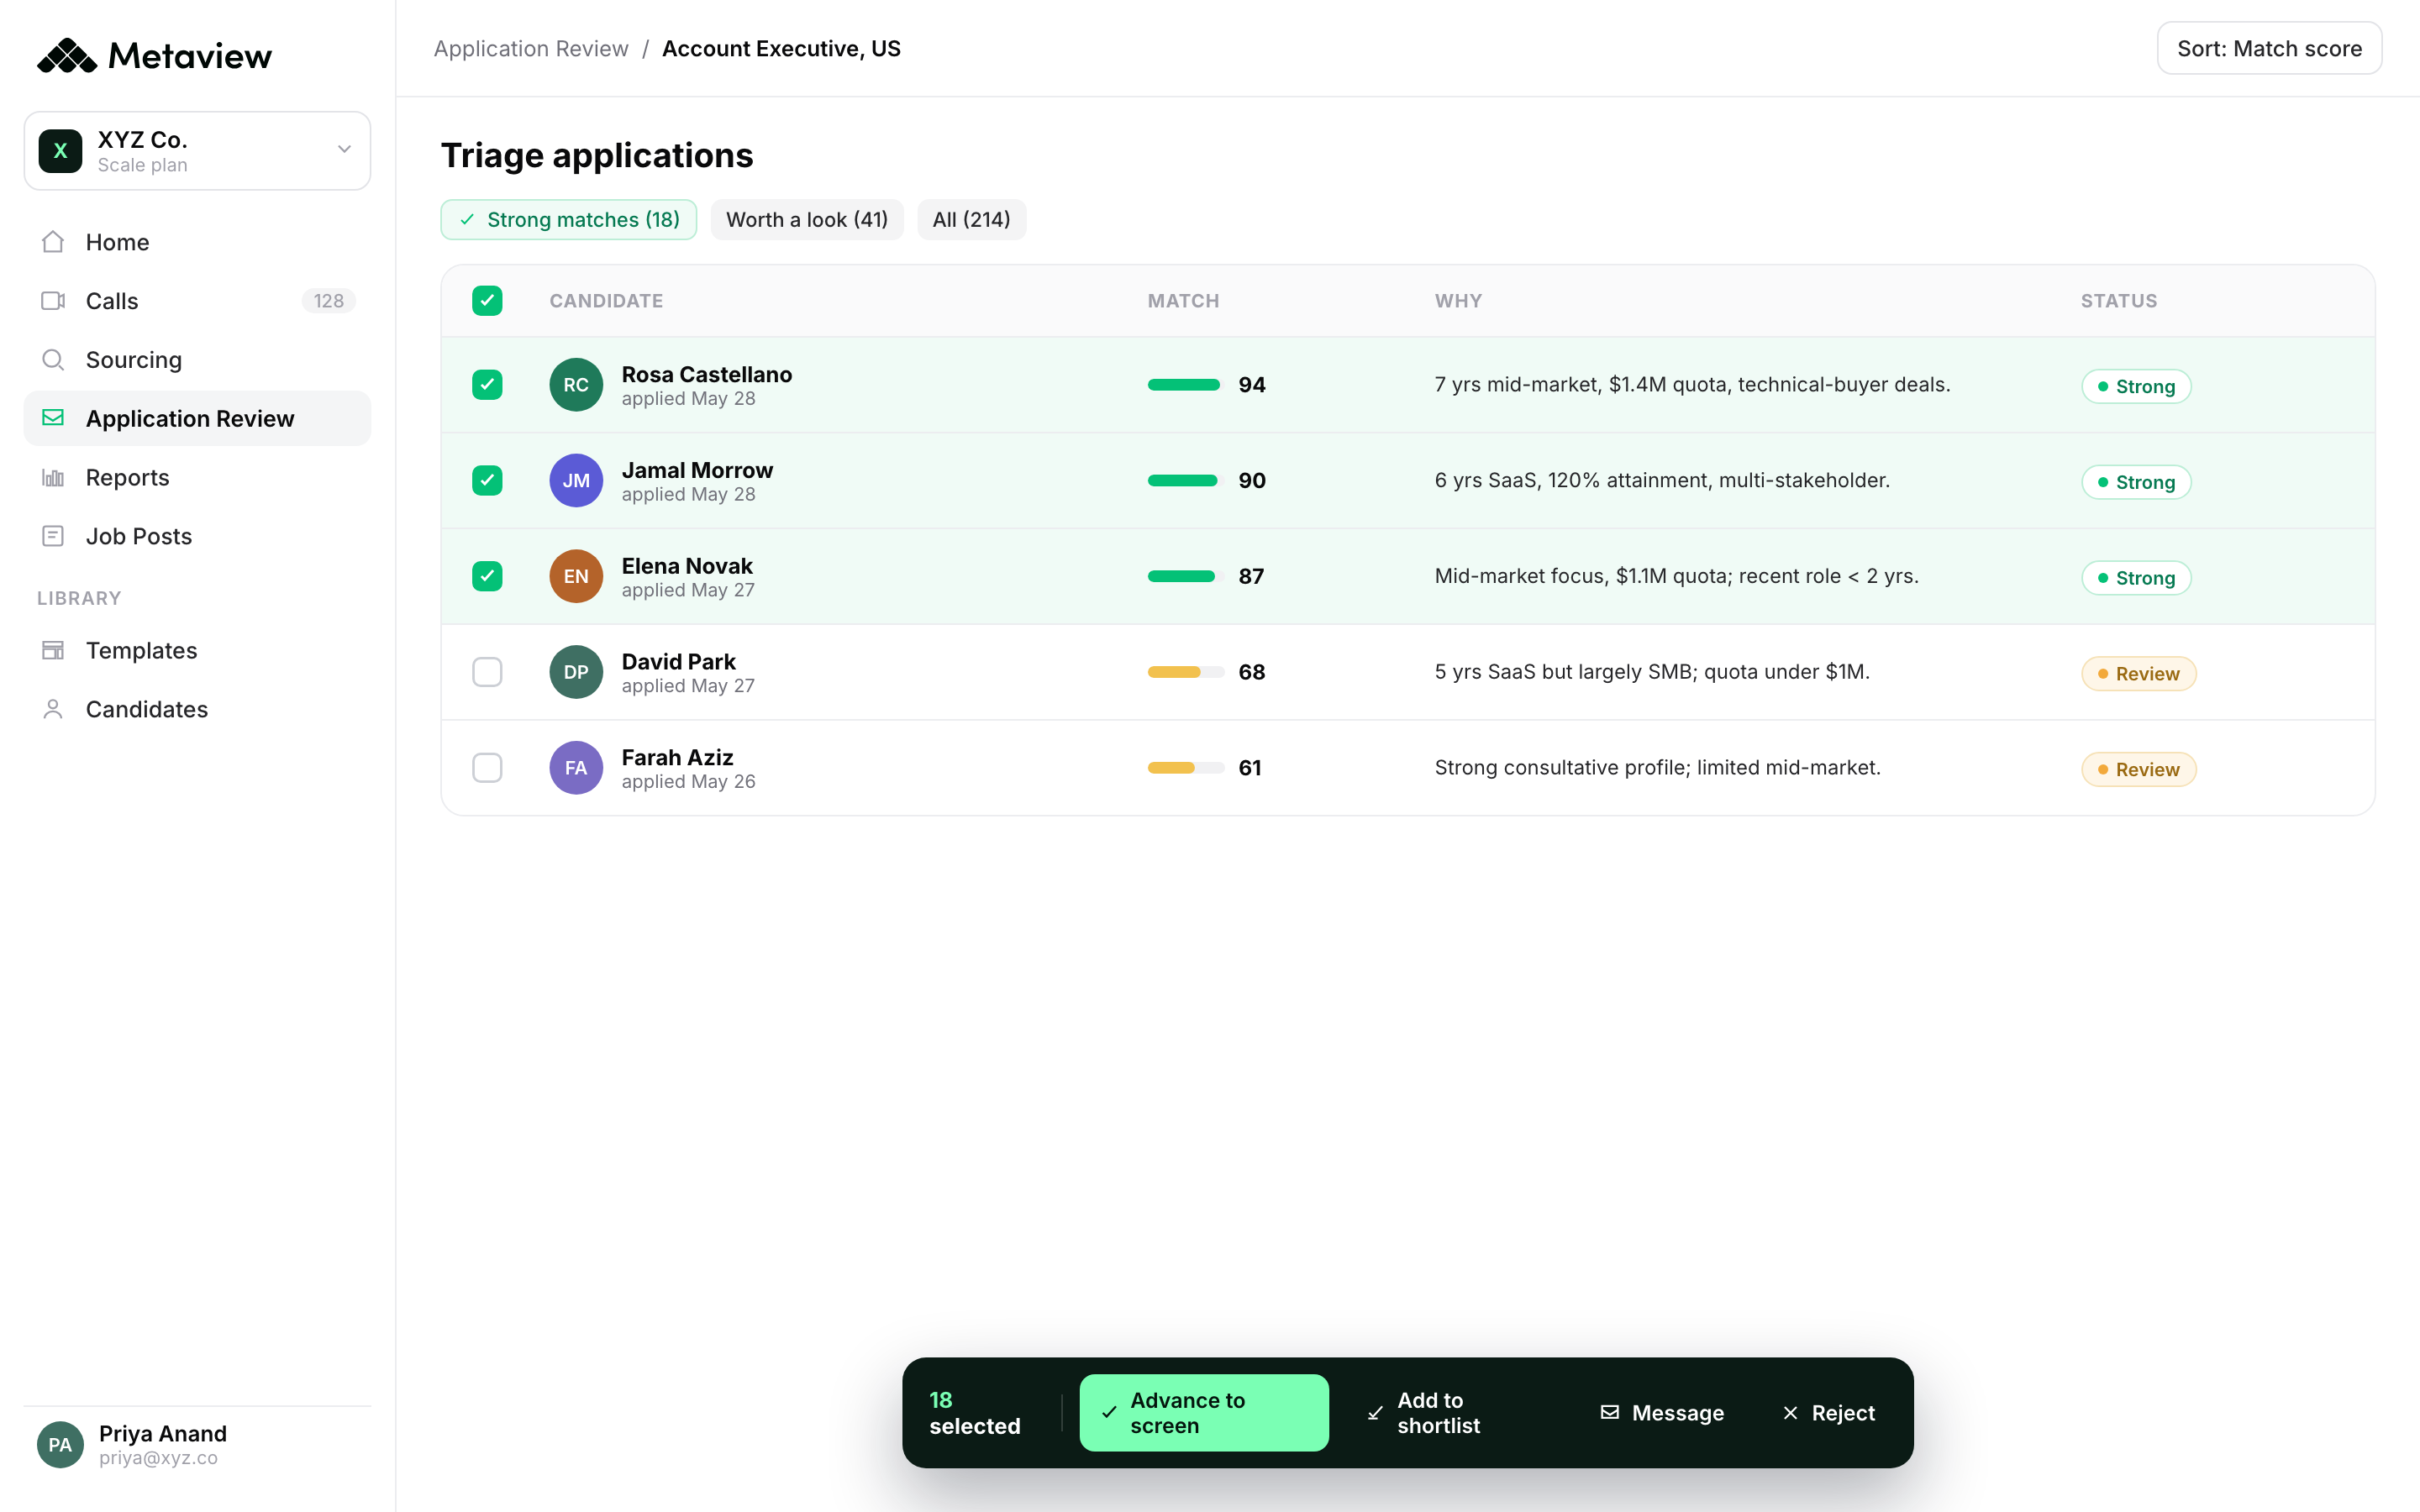
Application Review is Metaview's triage layer for inbound. It sits between the ATS and the recruiter screen. When a candidate submits, Application Review reads the application, scores it against the role's ICP, flags fraud and automation patterns, and posts the decision back to the ATS profile. The recruiter opens their inbox to a triaged list, not an undifferentiated stack of 412 applications from the last 24 hours.
The pieces below are what is shipped today against the Application Review surface. Each one was cross-referenced against the Metaview changelog before this article was published, so they are the real, in-production features, not roadmap copy.
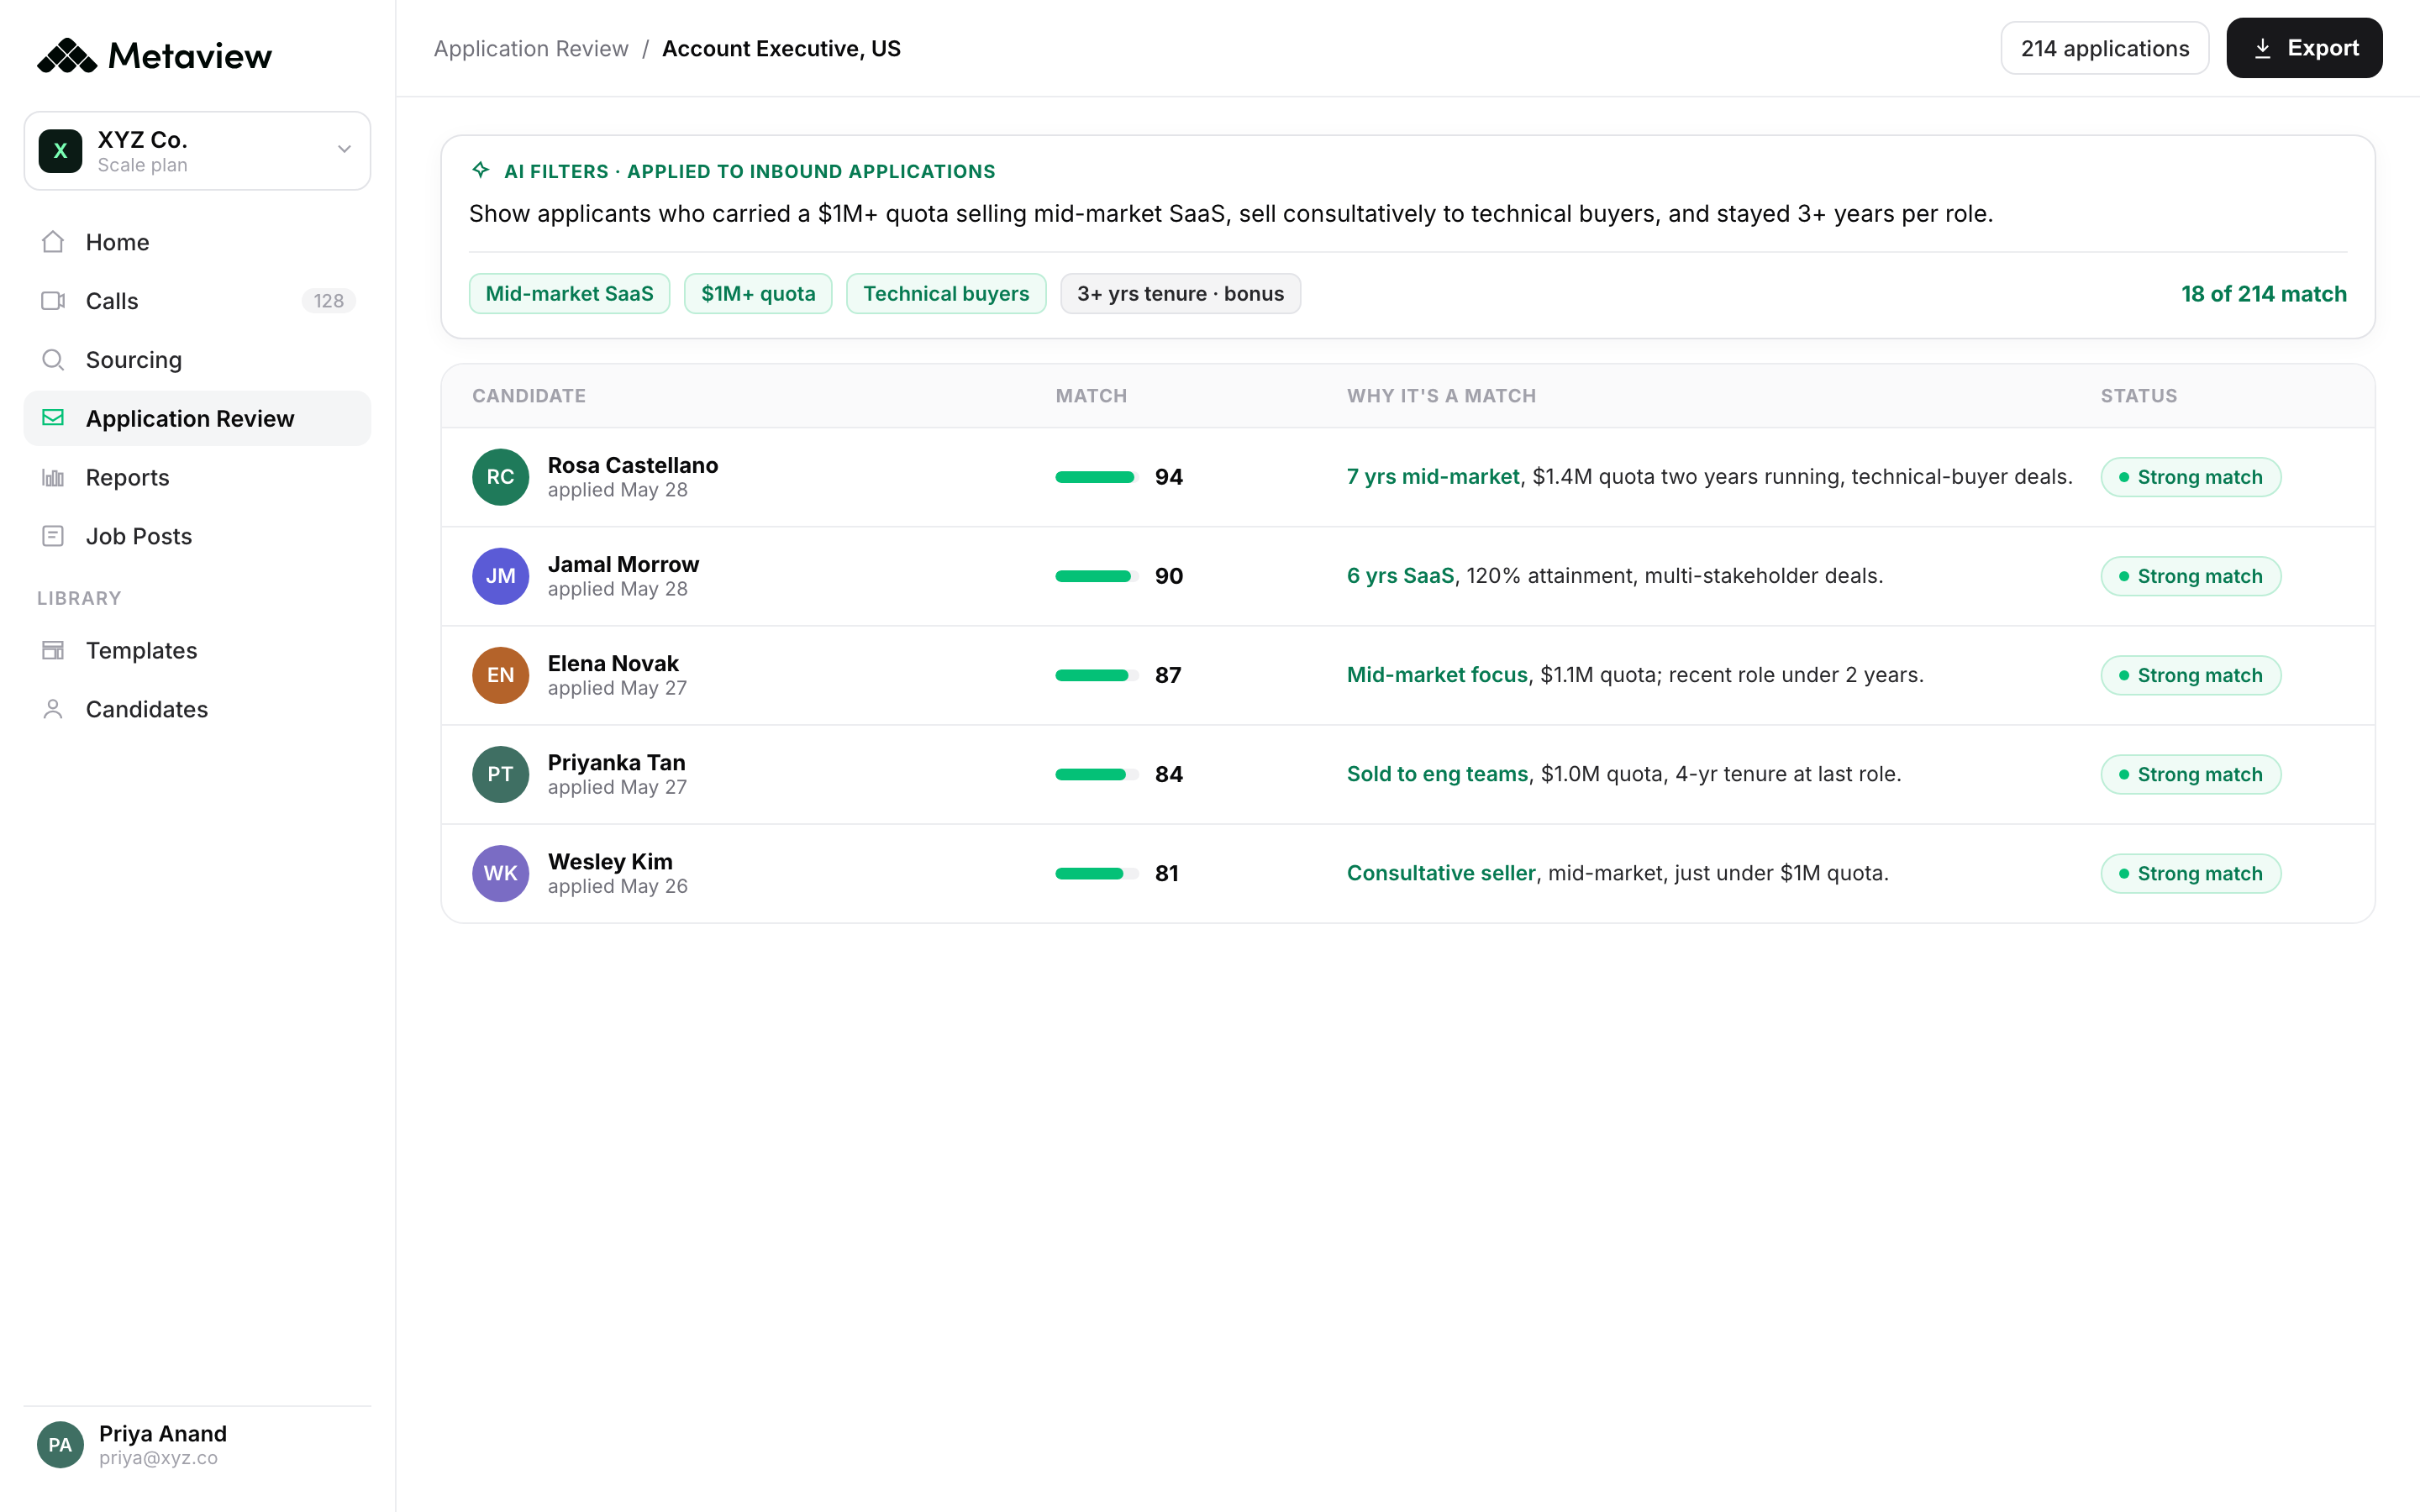
The ICP agent reads every inbound application against the role's ideal candidate profile and assigns a fit assessment. Workspace-wide ICP rules are configurable from the Admin Panel and apply at Application Review kickoff.
On by default. Flags identity-deception signals (email validity, LinkedIn consistency, work history sense) and automated-apply patterns (LazyApply, WhisperPost, unfilled answers, keyword stuffing, honey-trap questions). Critical for finserv and high-volume consumer-facing roles.
Creators of an Application Review get a daily email at 14:04 UTC outlining new great-fit or good-fit candidates from the last 24 hours. Mondays cover the weekend backlog. No email if there are no high-fit additions.
Accept/reject decisions and reasons in Application Review post back to the candidate's ATS profile. The Source column shows where each candidate originated. Supported ATSes: Ashby, Greenhouse, Gem, Lever, SmartRecruiters.
A 14-day completion-rate audit you can run now
If your completion rate dropped, do not call a meeting. Run this audit on a single role for two weeks. The whole thing fits in a recruiter's existing calendar.
- Day 1: pull the baseline. Export 30 days of started-vs-completed by role and source. Note the three roles with the worst rate and the three with the steepest recent drop.
- Day 2: open your worst form on a phone. Time how long it takes to submit. Note every retype, every login wall, every field where you would close the tab if you were the candidate.
- Day 3-4: make one cut. Pick the single highest-cost field on the worst role and remove it. Push the change live. Resist the urge to cut three things at once because then you cannot tell which one moved the metric.
- Day 5-7: instrument response time. Wire a dashboard that shows time-from-submit-to-first-recruiter-touch by source. If you cannot wire it, write it in a spreadsheet by hand. It will not stay accurate but it will start the conversation.
- Day 8-10: turn on triage. Stand up an AI-fit layer on the same role. Application Review takes about 10 minutes to connect if your ATS is one of the supported five. Set the ICP rules. Let it run for 48 hours before you look.
- Day 11-12: measure both halves. Compare completion-rate lift, recruiter response time, screen pass rate, and AI-flag rate against the day-1 baseline. If response time held or improved while completion-rate climbed, you have a working two-layer fix.
- Day 13-14: write up the playbook. Document what moved and what did not. Re-run on the next three roles in priority order. Anything that does not transfer is role-specific, which is fine. The system gets sharper one role at a time.
Bring Metaview into your hiring stack.
Live notes, structured scorecards, and ATS sync - set up in under 10 minutes.