
According to Metaview's 2026 AI & Hiring Alignment Report - surveying 505 recruiting leaders and hiring managers across North America and EMEA - 85% of companies exceeding their hiring goals use AI in hiring. Most of those companies will tell you they have a recruiting dashboard. Most of those dashboards are wrong about the most important question on them.
A dashboard tells you what happened in the funnel. It does not tell you what happened in the rooms. Every stage transition, every yes and every no, every move-forward and every silent reject, was driven by a conversation that almost no recruiting analytics tool can see. ATS exports can show that 38 candidates moved from screen to onsite last month. They cannot show whether the same competency got assessed for any of them, whether the panel asked the same role-defining question, or why the three who got offers were chosen over the two who did not.
That is the interview-shaped hole in your recruiting dashboard. Closing it is not a more elaborate report. It is a different data layer entirely, one built from the interviews themselves. This post walks through what TA leaders should actually be measuring, why ATS exports keep falling short, and how to wire interview intelligence into the dashboard so it stops describing the funnel and starts explaining it.
Why most dashboards measure the funnel and miss the rooms
Walk into any TA review and the deck will look the same. A pipeline funnel by stage. A time-to-hire trendline. A source mix chart. A heatmap of open requisitions by team. Every number on the slide came out of the ATS, because the ATS is the only system in the stack that records what happens to a candidate as they move through hiring.
That works for the parts of recruiting that look like a pipeline. It does not work for the parts that look like a conversation. A candidate moving from screen to onsite is an ATS event. The recruiter saying yes to that move is a judgment built from a 30-minute screening call. The hiring manager saying no on the way back is a judgment built from a 45-minute interview and a 10-minute debrief. None of those judgments live in the ATS. The ATS sees the verdict; it does not see the trial.
So the dashboard reports outcomes, but it cannot explain them. You can see that your reject rate after onsite is 62% for a given role, but you cannot see whether the same competency got assessed across the panel, whether the questions were even consistent, or whether the panel agreed on the bar in the first place. The dashboard ends exactly where the interview begins.
This is why two TA orgs with identical funnel shapes can produce wildly different outcomes. The funnel is the same. The rooms are not. And until the dashboard adds a data layer that comes from the rooms, the most expensive part of recruiting stays invisible to the team trying to manage it. (Funnel-shape work is covered separately in our guide to recruitment funnel analytics; here we are focused on the interview layer it can never reach.)
The four metric families every TA leader should track
Cut through every recruiting analytics framework on the market and the same four families show up. They are the only ones a TA leader can act on in any given week, and they are the ones a useful recruiting dashboard has to cover at minimum.
Each family has an ATS layer (the stage transitions and time deltas the ATS captures by default) and an interview layer (what got asked, what got assessed, what got missed, and how the panel agreed). The interview layer is the one missing from most dashboards. The table below is what changes when you have it.
ATS gives you volume + conversion per stage. The interview layer adds whether the same competencies were assessed at each stage, so the funnel becomes comparable across roles.
ATS shows time-to-hire and stage durations. The interview layer adds where decisions stall (debriefs, alignment gaps, scorecard delays), so you fix the cause, not the symptom.
ATS tells you who got hired. The interview layer pulls interview score, panel alignment, and competency coverage through to 90-day and first-review outcomes.
ATS measures recruiter throughput. The interview layer surfaces interviewer load, panel calibration, and template adoption so the team scales without burning down.
- Pipeline health: applications per opening, stage conversion, source mix, candidate experience signals.
- Hiring velocity: time-to-hire, time-in-stage, debrief turnaround.
- Quality of hire: interview score, panel alignment, competency coverage, 90-day and first-review outcomes.
- Operational efficiency: recruiter throughput, interviewer load, template adoption.
If you only ever fix one of these four, fix quality. Pipeline volume and hiring velocity are the families recruiters get measured on, but quality of hire is the only one that predicts whether the business hits its goals next quarter. The Alignment Report is unusually blunt on this point: 79% of teams with excellent relationships and high alignment exceed their goals, against only 36% of teams with fair-or-poor relationships and low alignment. Teams with poor partnerships are 3x more likely to miss. Quality is the leading indicator. The other three families are how you stay accountable to it.
Once you make a hire, we see the interview scores. How do we then validate the interview wasn't a false positive? Layer in quality, not just quantity, into the recruiter scorecard.”
The interview-shaped hole: what ATS exports never see
The fastest way to feel the hole is to write down a question your dashboard should answer and try to answer it. Try: across the last 50 senior engineering interviews, did the panel actually assess for the three competencies we said mattered? Or: where in the funnel are hiring managers losing alignment with recruiters on what role-ready looks like? Or: which interviewer on the panel keeps producing the offer-acceptance rate two points below everyone else's, and which question are they leaning on?
Every one of those questions matters. None of them can be answered from an ATS export. They sit in the recordings, the notes, the scorecards, the debrief threads, and the intake calls that have never been treated as queryable data. They are the rooms, and most TA orgs cannot get into them at scale.
The standard fallback is to spot-check. A TA leader sits in on three panels a quarter, reads ten scorecards out of three hundred, listens back to one recording every other week, and tries to triangulate. It is heroic, it is expensive, and it does not scale past about one or two roles a quarter. The rest of the org keeps running blind.
There is a second fallback, which is to make hiring managers fill out more structured scorecards, more often, with more required fields. This works on paper. On the ground it produces lower compliance, slower debriefs, and scorecards that are increasingly written to satisfy the form rather than describe the interview. A scorecard is a downstream artifact of the conversation, not a substitute for it.
The real fix is not more forms. The real fix is a data layer that gets built from the interview itself, automatically, and that can be queried the way a TA leader queries the ATS today. That is what Metaview is.
How Metaview's interview intelligence layer closes the gap
Metaview joins every interview your team runs (over Zoom, Teams, Google Meet, or in-person) and turns the conversation into a structured, queryable record. It transcribes, summarizes against the scorecard you brought into the room, tags which competencies were actually covered, lifts the strongest verbatim moments, and writes the result back into your ATS in the format your hiring managers already read.
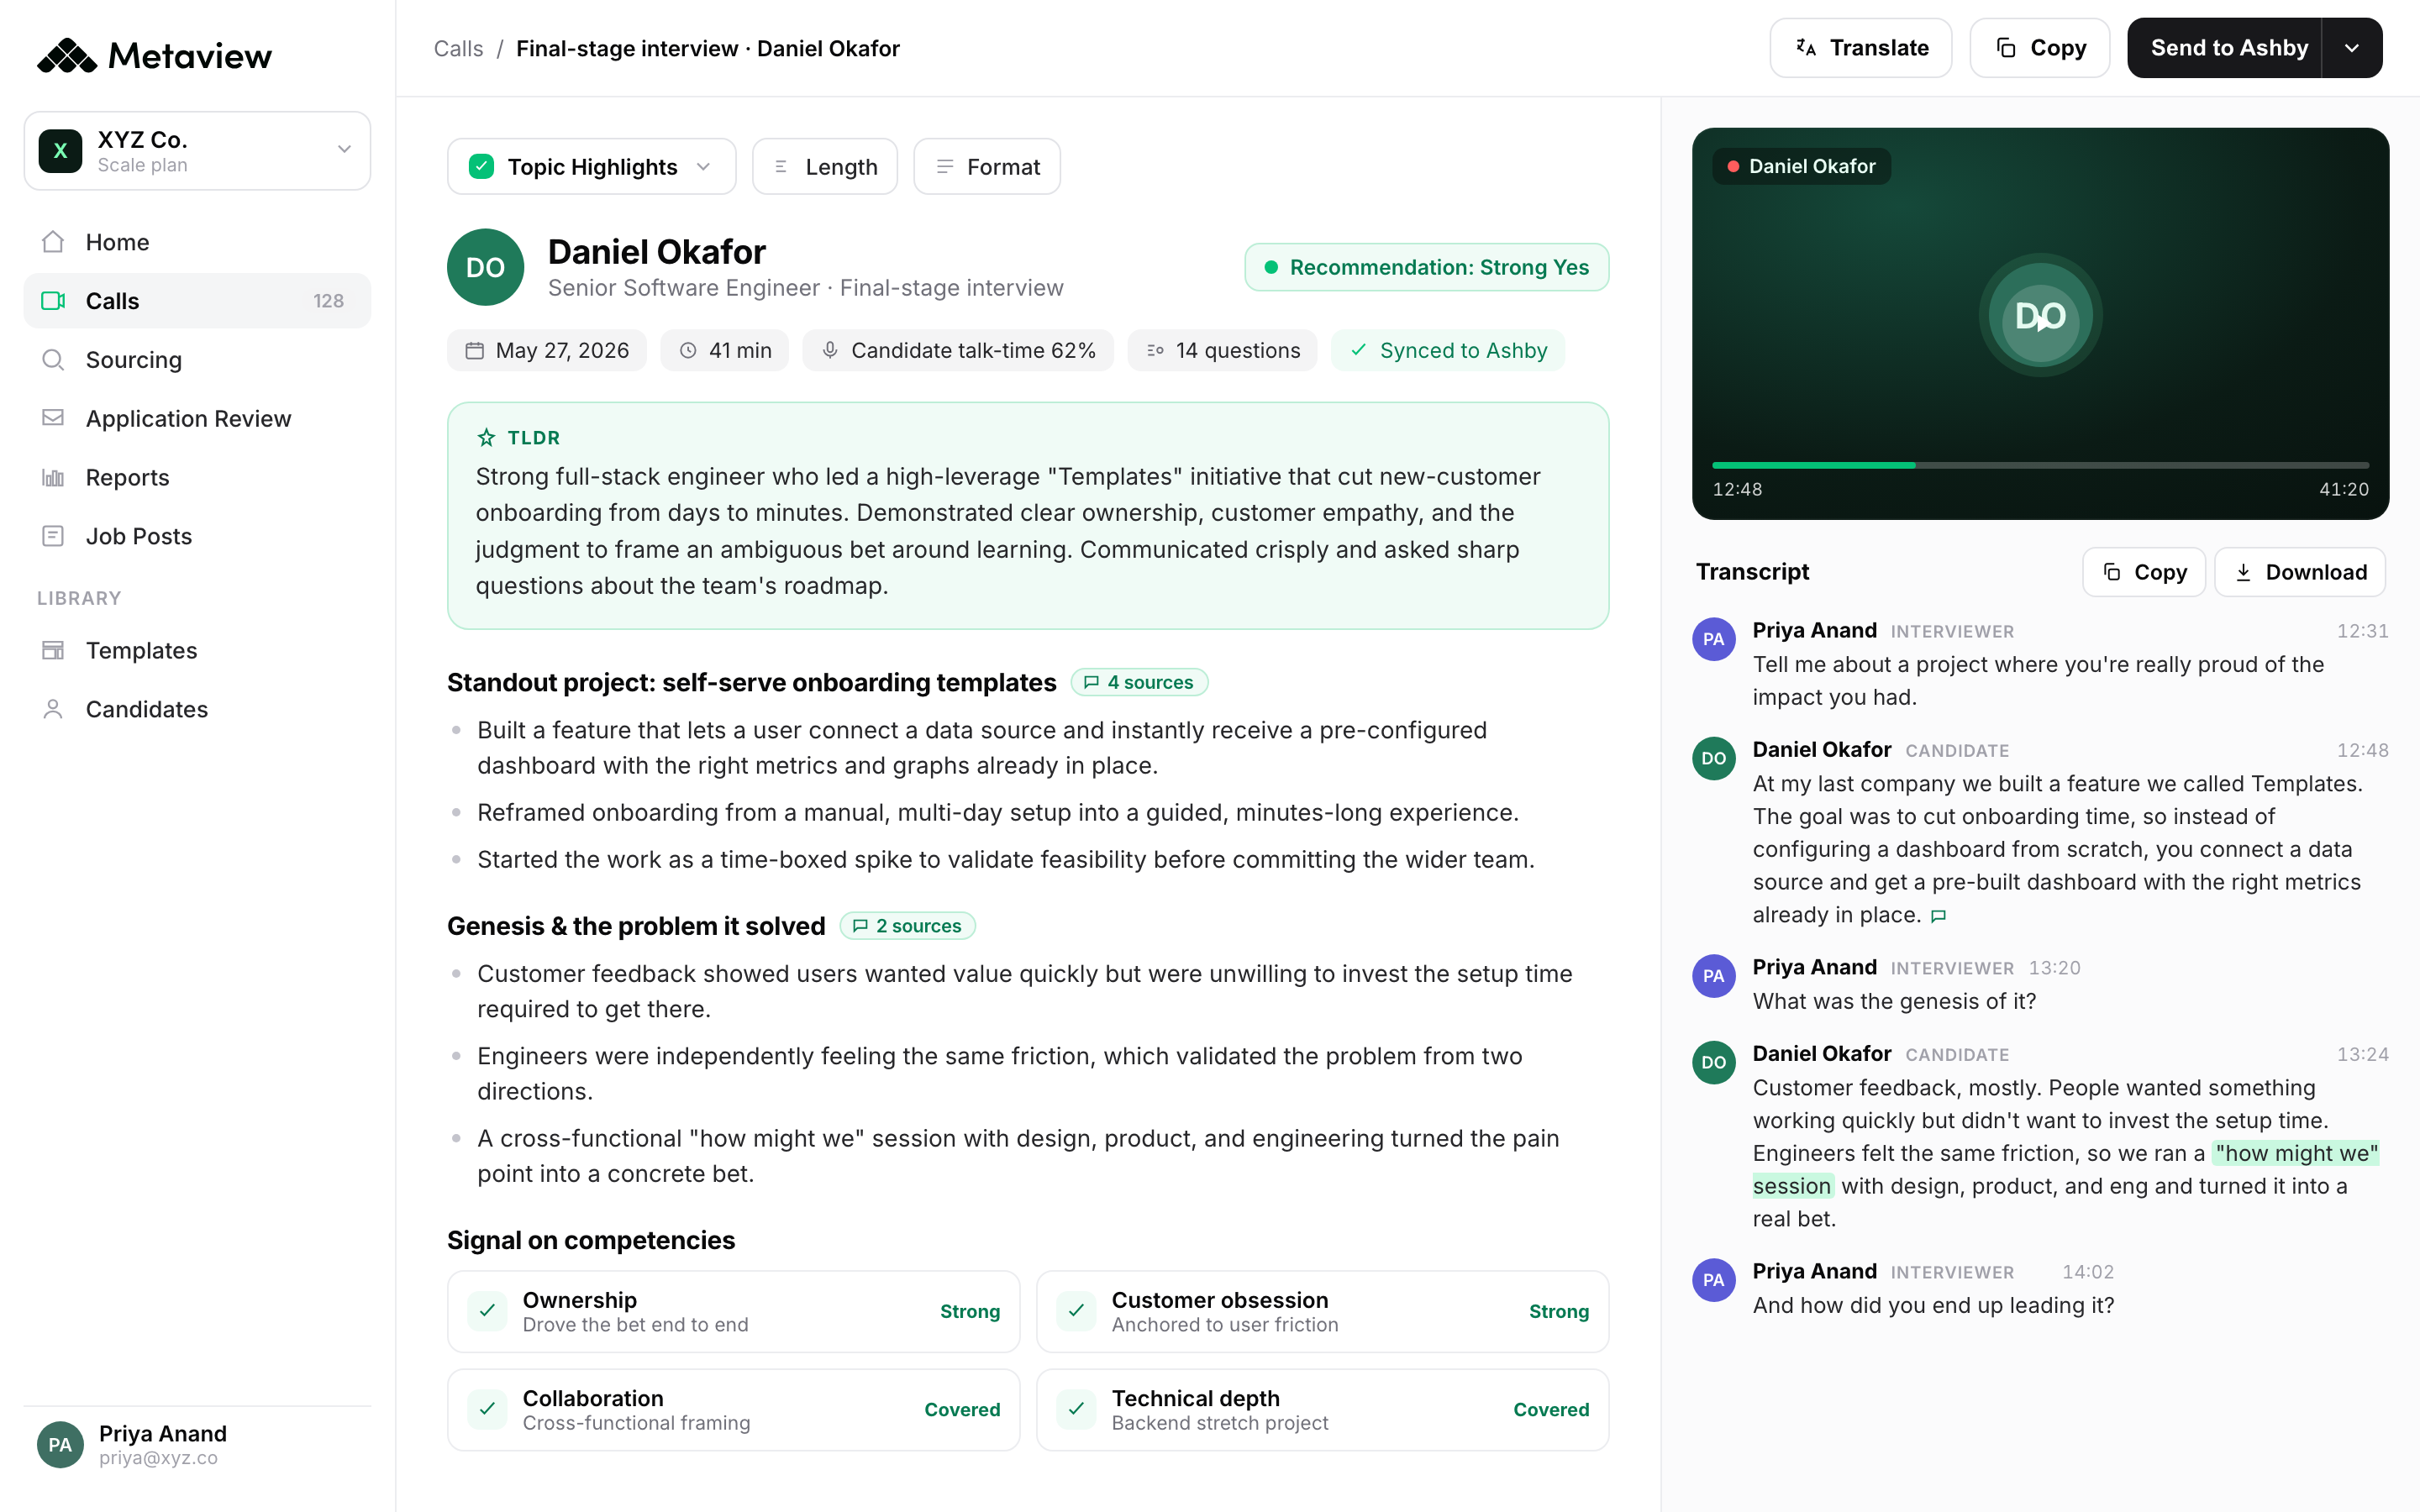
What that produces, dashboard-wise, is a parallel layer. Every funnel transition in the ATS now has a paired interview record next to it. Every reject after onsite carries the competency the panel was actually grading. Every offer carries the agreed evidence the panel signed off on. The dashboard stops being a list of outcomes and becomes a system that can be interrogated. The contrast below is what teams describe before and after.
- Dashboard reports stage transitions, but no one can say why a candidate moved or stalled.
- Quality of hire is a 90-day retro guess, not a live signal you can act on.
- Spot-checking three panels a quarter is the only way a TA leader sees what got assessed.
- Hiring managers and recruiters debate from feeling, not from evidence the dashboard captured.
- Every transition is paired with the interview record (questions asked, competencies covered, panel agreement) that drove it.
- Quality of hire becomes a leading signal: interview score, competency coverage, panel calibration, all live in the dashboard.
- TA leaders can query 50 interviews a week from a dashboard view instead of sampling three a quarter.
- Debriefs run from a shared, structured record. The dashboard captures the evidence at the moment it gets created.
The product surfaces that produce this layer are not abstract. AI Notes generate the structured note from every interview against the template you set. AI Reports roll that data into the dashboard view, and ATS Custom Field Filters let you slice by job type, seniority, or any custom field the ATS already carries. AI Filters add saved natural-language slices ('senior backend roles where the system design round wasn't covered', 'panels where two interviewers diverged by more than one point'). The Reports MCP lets you point Claude or any other MCP-compatible AI client at the same data and ask questions in plain English. The dashboard stops being a static slide and starts being a conversation with the interview record.
From report card to operating tool
Most TA dashboards are graded on whether they show the right numbers at the all-hands. That is a reporting use case. It is not the highest-leverage one. The dashboard with an interview layer is graded on whether it changes a decision the team makes inside the same week the interview happened. That shift, from report card to operating tool, is the second-order win of the layer.
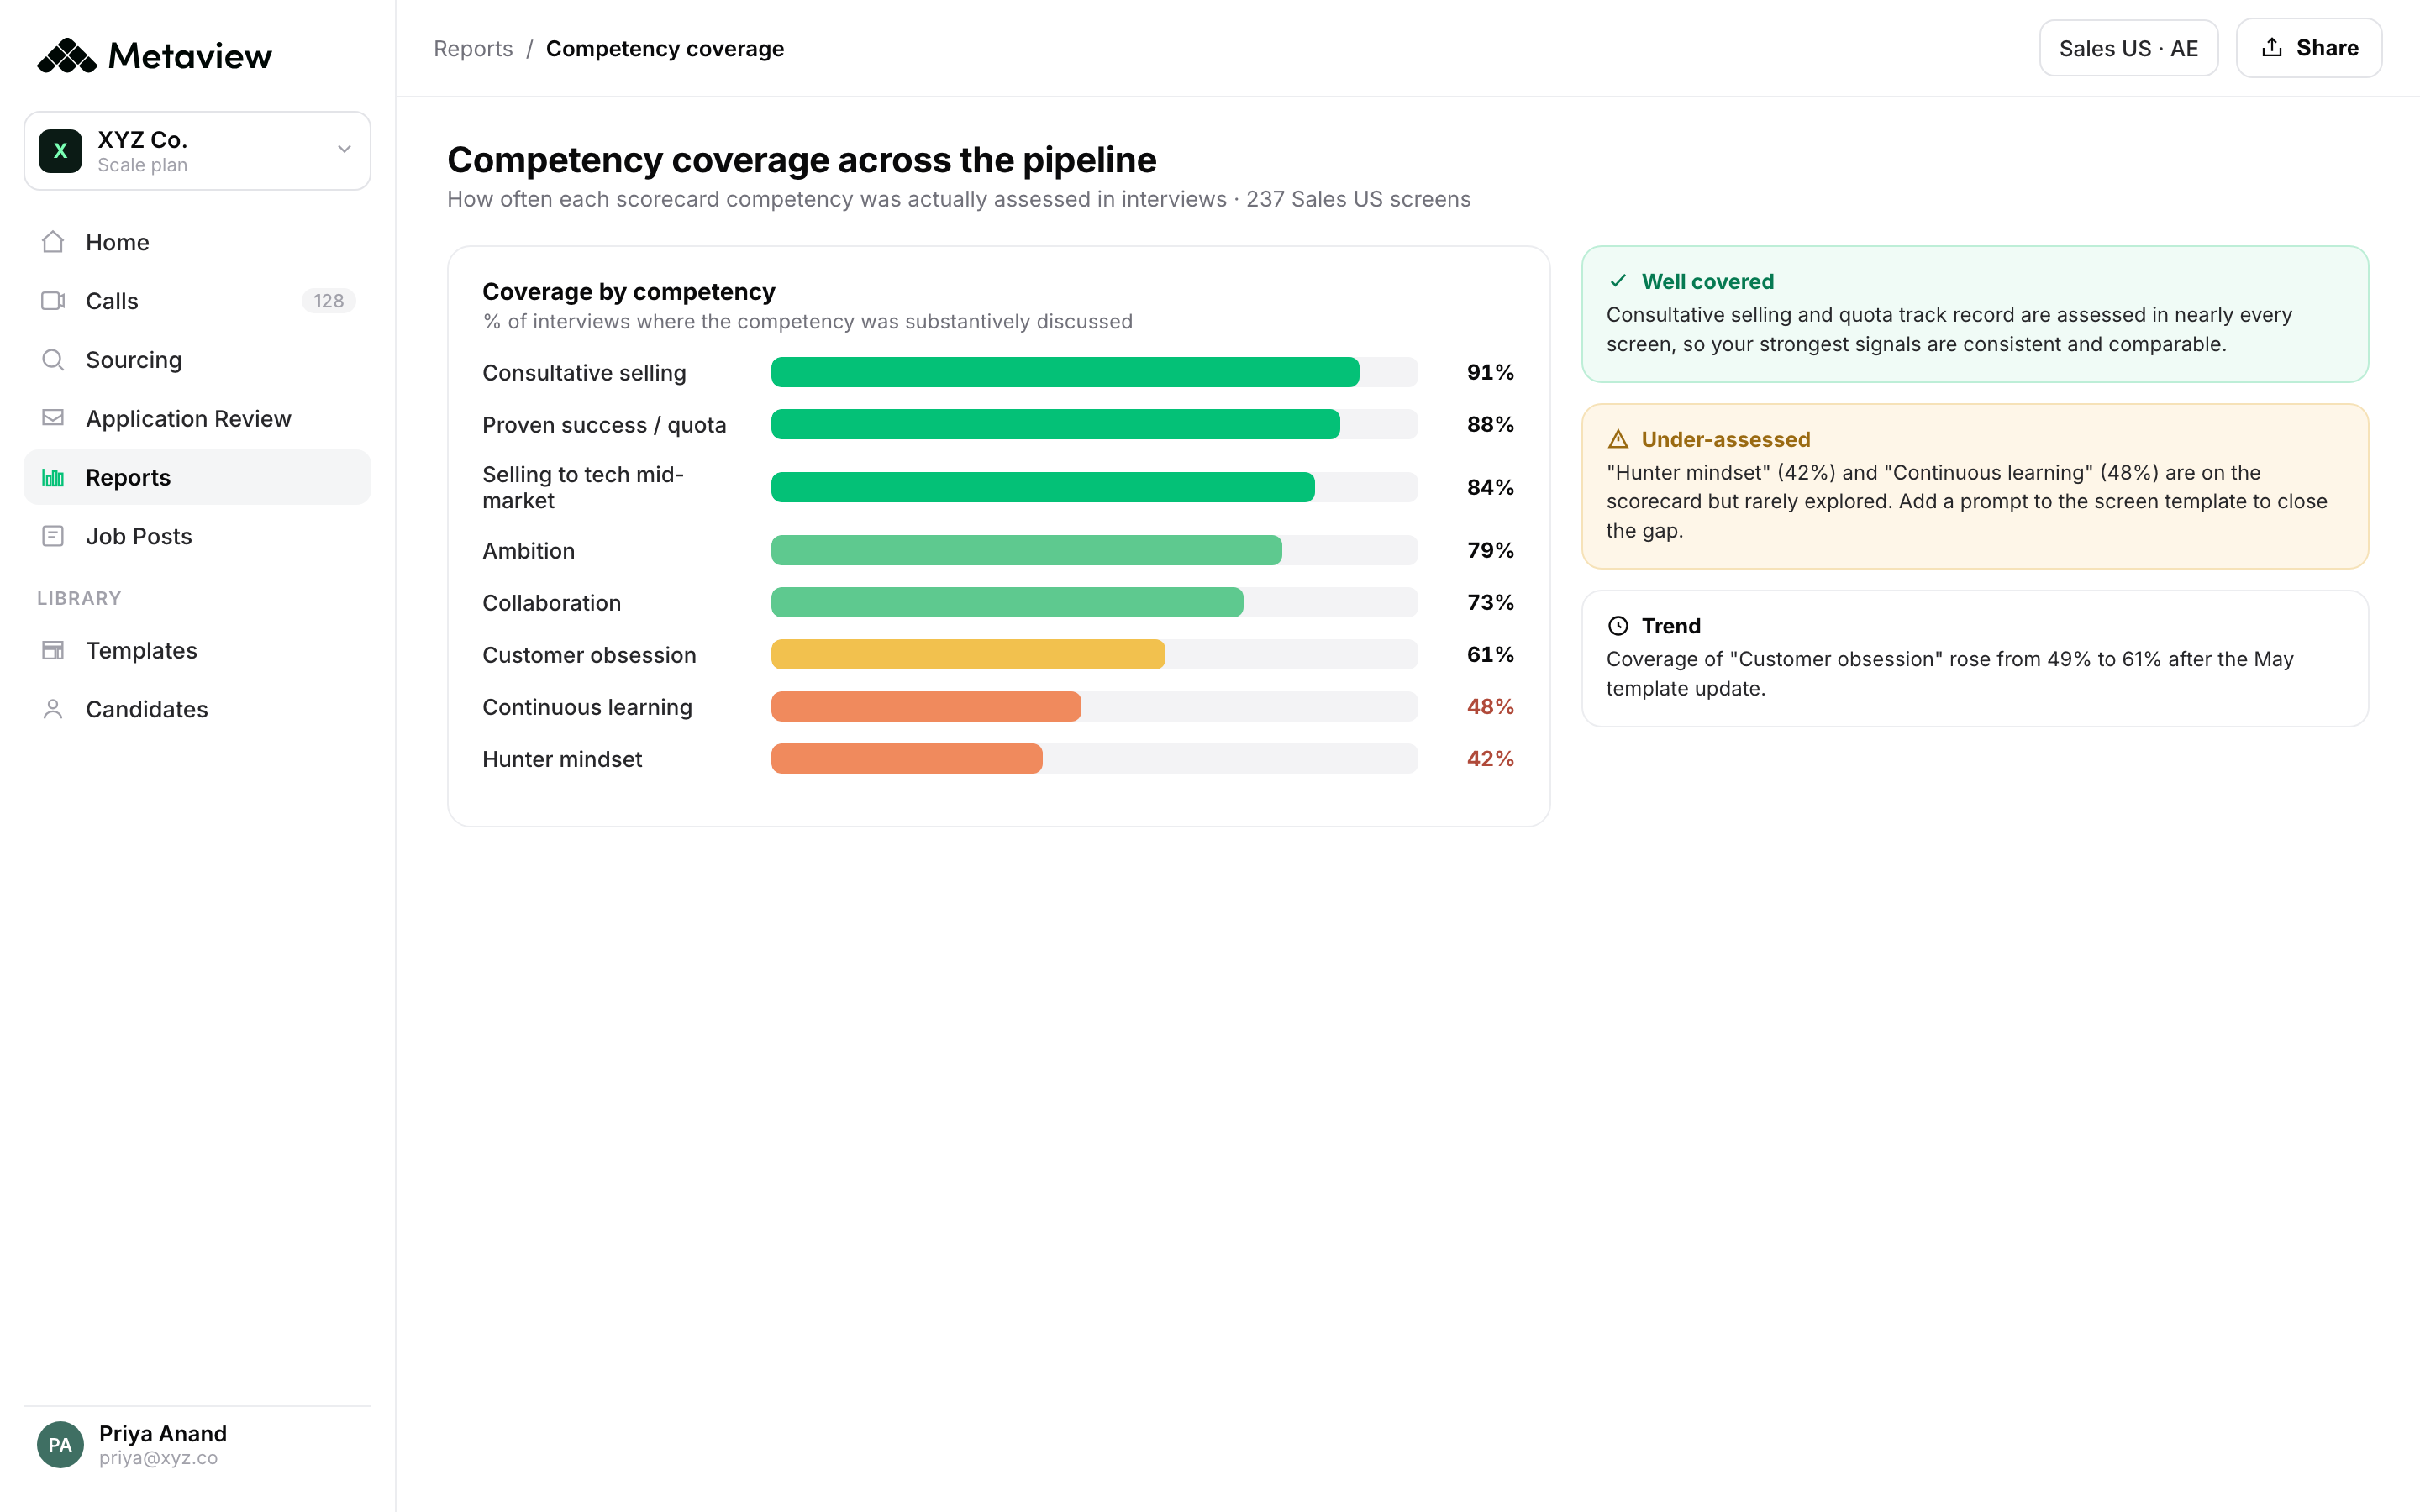
Three operational decisions get noticeably better. The first is the panel-design decision. When the dashboard shows that competency coverage on a senior IC role is 64% on average (the panel only assessed two of the three competencies in two-thirds of loops), the answer is to redesign the panel or the interview template, not to push recruiters harder. The second is the calibration decision. Two interviewers diverging by more than one point on the same dimension across the same five candidates is a coaching signal, not a hiring signal, and the dashboard surfaces it before it becomes a closed-loss pattern. The third is the intake decision. Hiring managers who describe a role one way at intake and grade for something else at onsite are the single largest source of recruiter-hiring-manager friction, and a queryable interview record lets the TA leader catch the drift inside the first two weeks of the search.
 Siadhal Magos
Each of those decisions is the kind of thing that, before the interview layer existed, either did not happen at all or happened a quarter too late. The dashboard becomes the place a TA leader actually runs the function, not the place she summarizes it for leadership.
Over the last few months, our Talent Acquisition team has been using Metaview, and it has made a significant impact. What excites me most is how Metaview is freeing up our time. While the AI handles the heavy lifting of summarising discussions, we're able to engage in more meaningful conversations with candidates. We're now even using Metaview for our briefing calls with Hiring Managers, allowing us to gain a deeper understanding of the roles we're sourcing for.”
How to turn the interview layer on in your stack
Wiring this up is shorter than most TA leaders expect. The interview layer becomes a dashboard-ready feed after three steps, all of which happen in Metaview settings.
- Step 1 - Connect your ATS. Metaview has native two-way integrations with Greenhouse, Ashby, Lever, Workday, SmartRecruiters, and more. Notes and structured reports write back as candidate attachments and custom fields, so the dashboard you already share with leadership picks them up without a redesign. (Detail in our ATS integrations guide.)
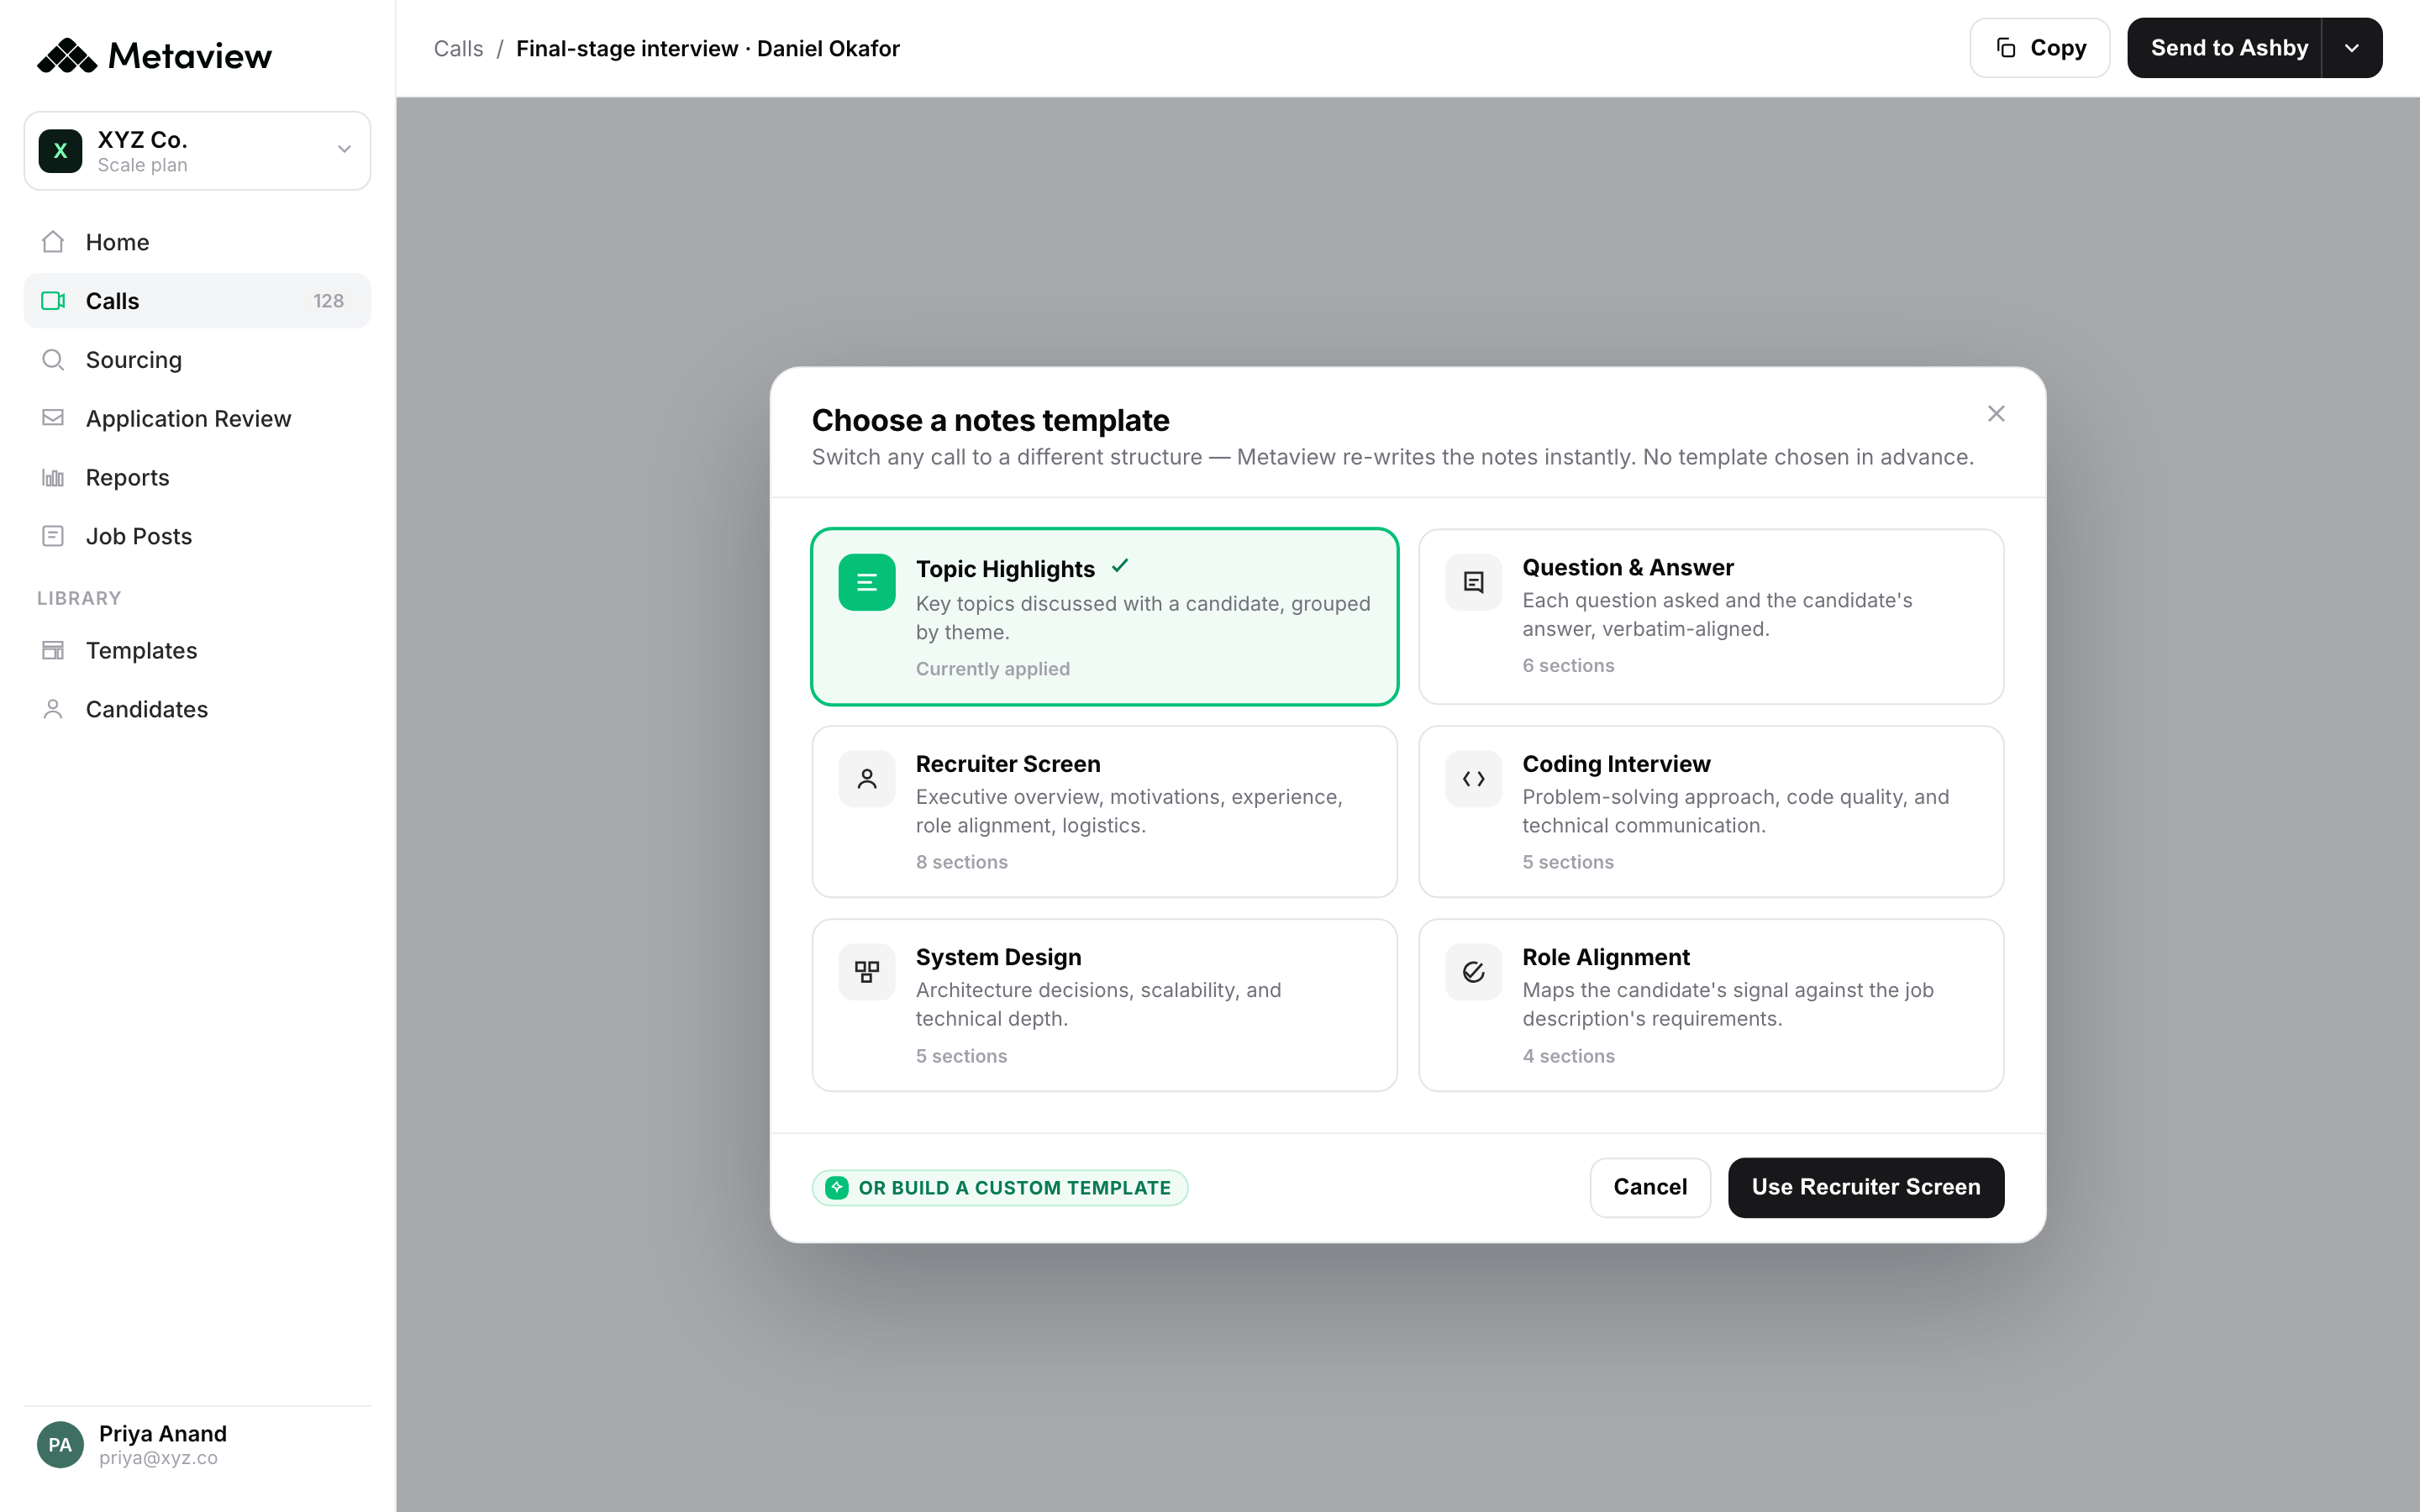
- Step 2 - Pick the templates the panel will work from. Set the scorecard structure once per role family. Metaview auto-detects which template applies based on the calendar invite and the ATS record, so interviewers do not have to pick. The structure is what makes the data layer comparable across interviews, panels, and roles.
- Step 3 - Stand up the Reports view that lives next to your ATS dashboard. Start with three views: competency coverage by role family, interviewer-level alignment, and quality-of-hire pull-through (interview score versus 90-day or first-review outcome). That is the minimum viable interview layer. From there, AI Filters and the Reports MCP let you slice however the operating cadence demands.
The first time the layer becomes useful is usually inside the first two weeks. Most TA leaders we work with discover something inside the data they were not expecting (a question that never got asked, a competency that was systematically skipped on a specific role, an interviewer whose calibration was off in one direction) before they have even finished rolling Metaview out to every recruiter.
Bring Metaview into your hiring stack.
Live notes, structured scorecards, and ATS sync - set up in under 10 minutes.
Recruiting dashboard FAQs
What is a recruiting dashboard, in practical terms?
A single view that shows the health of every hire the team is running. The minimum useful version covers four families of metrics: pipeline health (volume and conversion by stage), hiring velocity (time spent and trends), quality of hire (the longer-tail outcome metrics), and operational efficiency (recruiter and panel productivity). What separates a useful dashboard from a wallpaper one is whether it also includes an interview layer alongside the ATS layer, so TA leaders can see what got asked, covered, and agreed on, not just which stages a candidate passed through.
Which metrics should we start tracking first if we are building a recruiting dashboard from scratch?
Start with one metric from each of the four families: applications per opening (pipeline), time-to-hire (velocity), interview-score-to-90-day-outcome correlation (quality), and recruiter throughput in interviews per week (efficiency). That gives you a complete picture inside one view. Add a competency-coverage metric from the interview layer once Metaview is integrated. That single metric usually surfaces more actionable insight in the first quarter than any of the four ATS metrics on their own.
Why aren't ATS exports enough on their own?
An ATS captures stage transitions and the metadata that comes with them: source, time, owner, outcome. It does not capture what happened inside the interview, because no one writes the panel conversation back into the ATS structured fields in a way you can query. So the dashboard can report that 38 candidates rejected at onsite, but it cannot tell you whether the panel asked the same role-defining question of each, whether the bar was applied consistently, or which competencies the team was actually grading. That is the layer Metaview's AI Notes and AI Reports fill in.
How does Metaview integrate with our existing recruiting analytics stack?
Metaview has native two-way integrations with Greenhouse, Ashby, Lever, Workday, SmartRecruiters, and others. Structured notes and AI Reports get written back as candidate attachments and ATS custom fields, so the dashboard you already run in the ATS (or in Looker, Tableau, or any BI tool downstream of the ATS) picks up the new data layer without a custom build. For teams that want to query the interview data directly, the Reports MCP exposes the same dataset to Claude or any other MCP-compatible AI client in natural language.
Who should own the recruiting dashboard inside the org?
The TA leader owns the dashboard. The recruiting ops or analytics lead (if you have one) owns the feeds and the views. The hiring managers should consume it weekly during loop reviews. The mistake to avoid is the one where IT or BI owns the dashboard because they own the BI tool. Recruiting metrics decay fast (a six-week-old conversion rate is already wrong), and the team that owns the decisions has to own the view that informs them.
How is a recruiting dashboard different from recruitment analytics?
A recruiting dashboard is the persistent, monitored view of the metrics the team operates against every week. Recruitment analytics is the broader practice of pulling, cleaning, and analyzing the underlying data, often for one-off questions that do not need a permanent surface. Dashboards live; analytics answer. A useful TA function needs both, and the same interview layer that powers the dashboard is what makes the deeper analytics work answerable in hours rather than weeks.