
It is Tuesday afternoon. A head of talent acquisition opens the quarterly report. Net hire ratio for Q1: positive 4%. The team grew. The number is directionally fine, even good. Then comes the gut-check moment that does not show up in any dashboard: the 12 employees who left this quarter included 3 of the strongest engineers from last year’s Series A acquisition, 4 from the support org six months in, and 2 senior ICs who had been promised more scope and got tired of waiting. The ratio is positive. The team is structurally weaker.
Net hire ratio looks like a hiring metric because the numerator is hires. It is not a hiring metric. The formula directly subtracts departures, so any quarter’s number is half-determined by who walked out the door, and most of that exit decision was set during the interview loop that brought each leaver in. According to Metaview’s 2026 AI & Hiring Alignment Report - surveying 505 recruiting leaders and hiring managers across North America and EMEA - 90% of teams call their cross-functional partnership good or excellent, while 58% actively contemplate working around their counterpart. Teams with poor partnerships miss their business goals 3x as often. Recruiting output is downstream of a signal layer those teams are not connecting on.
The four levers in this post sit upstream of the funnel, at the interview itself, where the first 90 days of attrition get largely decided. Each one compresses both sides of the formula at once: more hires that stick, fewer departures from people the team should never have hired the first time. None of them require adding requisitions or recruiters.
What net hire ratio actually measures
Net hire ratio is the percentage of net workforce change against average headcount. If a team hires 40 people in a quarter, 30 people leave, and the average headcount is 200, the ratio is (40 minus 30) divided by 200, which is 5%. The workforce grew 5% during the period. It is a simple calculation. What it is not simple about is what it actually rewards.
The metric quietly punishes high-turnover orgs and quietly rewards calibrated ones. A team that hires 60 people and loses 20 looks identical on a hiring-volume dashboard to a team that hires 60 and loses 4. The first team has a 4% net hire ratio against a 100-person base; the second has a 56% ratio against the same base. Volume is the same. The signal-layer reality is not.
Net new hires (hires minus departures, in raw numbers) tells you absolute change. Net hire ratio normalizes that against company size, so a 20-person net add at a 1,000-person company reads correctly as a 2% workforce ripple, not a victory lap. The two metrics travel together; the ratio adds proportional context.
That last sentence is the part the original definition leaves out. The ratio is a lagging metric. The hire-vs-leave decision was already made upstream, by the people running the interviews, when they decided who was strong enough to extend an offer to. Everything downstream is the metric catching up to a call that was already made.
Once you make a hire, we see the interview scores. How do we validate the interview wasn’t a false positive? We have a 90-day check we need to do more consistently. The idea I’m kicking around is, what if a hire that gets a 4 (the highest calibration score) is worth more than one hire on the recruiter scorecard. Layer in quality, not just quantity.”
The formula (and the 4 inputs it hides)
The standard formula is (number of hires minus number of departures) divided by average headcount. Some teams use starting headcount instead of average; others calculate monthly versus quarterly. What matters is consistency, so trend lines stay readable across periods.
For a 200-person team with 40 hires and 30 departures in a quarter, the ratio is (40 minus 30) divided by 200, which is 5%. For the same team at 800-person scale with 100 hires and 90 departures, the ratio is (100 minus 90) divided by 800, which is 1.25%. Volume up 2.5x. Net workforce impact down 75%. The formula made the change visible; the question is what to do about it.
The 4 inputs the formula hides
Each variable in the equation is a stand-in for an operational lever the formula does not name.
- Hires is a function of sourcing quality, screening rigor, and offer-acceptance rate. The number says nothing about whether each hire was the right person for the role.
- Departures is a function of how well the interview loop predicted on-the-job performance and culture fit. Most regrettable attrition was foreshadowed in the interview but never written down.
- Average headcount is downstream of both. A team in expansion mode looks different than a team in steady-state, even at identical ratios.
- The minus sign. The most overlooked input. The formula treats a departure as exactly equal in magnitude to a hire. Operationally they are not equal: a regrettable senior loss can erase 4 to 6 junior hires of operational impact.
The four levers below are the ones that move all four inputs at once. They sit upstream of every metric most TA orgs already track.
The 4 levers that actually move net hire ratio
Most published advice on raising net hire ratio reduces to two suggestions: hire faster, reduce attrition. Both are true. Both are also useless without a mechanism. The four levers below are the mechanism. They share a common feature: each one operates on the interview signal layer, not on the funnel.
Every interview, every panel, structured into shared notes the moment the call ends. No reconstruction from memory. No detail lost in DM threads or fading whiteboard photos.
Reports surfaces outlier scorers and competency-coverage gaps across panels. Re-calibrate the panelist who is two standard deviations off, not the candidate.
Cross-panel summaries collapse the hiring-manager debrief from 15 minutes to one. The candidate moves before they take the other offer that lands on Thursday.
Application Review and Reports tie sourcing and screen inputs back to first-90-day hire outcomes. The recruiter scorecard learns from quality, not just volume.
The order matters. Signal capture comes first because nothing else works without it: you cannot calibrate interviewers you cannot see, you cannot pace decisions on summaries that do not exist, and you cannot close the recruiter loop on data the system never recorded. Most teams jump to calibration training or scorecard redesign and skip the capture layer. The training does not stick.
Once capture is in place, the other three levers compound. A panelist whose scores consistently land 1.5 standard deviations above peers, but whose hires churn at twice the rate, becomes visible within 30 days. The hiring-manager who takes 9 days to debrief shows up against the manager who takes 4. The recruiter whose sourcing produces strong-yes outcomes 47% of the time can be replicated by the recruiter whose rate is 22%. None of this is possible from raw funnel data.
Why interview signal quality is the upstream input
Signal quality is what gets asked, how it gets asked, and how the response gets evaluated against the role’s actual rubric. Strong signal means a panel covered all five role-critical competencies, each interviewer asked similar enough questions that responses are comparable, and the scoring distribution lines up with the rubric’s definition of good. Weak signal means the interview was a rapport check, the panel covered three of five competencies (and not the same three across rounds), and scores are bunched at 3 of 5 because nobody wants to stake the call.
Weak signal upstream produces three downstream effects on net hire ratio. First, more false positives: hires that look strong on paper, weak on the job, and exit within 90 days. Second, more false negatives: candidates who would have been strong hires get rejected because nobody asked the right competency questions. Third, slower decisions: hiring managers stall because the interview record does not give them what they need to be confident, so the candidate takes the offer from the competitor who decided on Friday.
- Attrition is counted at month 3 to 6 with no upstream visibility into which interviewer or which competency miss predicted it.
- Net hire ratio is reviewed quarterly with no diagnostic input. The number is the conversation; the cause stays opaque.
- Headcount additions chase attrition without addressing source. Backfill velocity is celebrated. Net workforce growth stays flat.
- Hiring managers blame recruiter sourcing; recruiters blame hiring-manager calibration. Both are partly right and there is no record to settle it.
- Interview signal quality is captured per panel, per competency, per question. Attrition gets a paper trail back to the interview loop.
- Outlier scorers and competency-coverage gaps surface in Reports. Calibration happens in week one of a quarter, not after the next bad hire.
- Application Review pre-screens upstream of the panel, so the panel time goes to candidates with a real fit signal, not to triage.
- Recruiter scorecard ties sourcing and screen inputs to first-90-day hire outcomes. The quality loop closes inside the quarter the hire happened.
The shift in the right column is not a tool swap. It is a structural change in where the recruiting org accumulates intelligence. Without the signal layer, every quarter the team starts over with whatever the hiring managers remember. With it, the team compounds: panelists get sharper, rubrics get more precise, scorecards learn from outcomes.
How to track the leading indicators
Net hire ratio is a lagging metric: by the time it moves, the decisions that moved it are 60 to 120 days behind you. The leading indicators are the ones that show up in the interview record within 7 to 14 days of a panel ending. There are four worth tracking weekly.
Signal-quality score per panel. Did the interviewer cover all role-critical competencies? Did the questions match the rubric? Is the response evaluation reproducible by another interviewer reading the notes cold? A panel that scores high on signal quality predicts a hire that stays.
Interviewer scoring drift. Pull each interviewer’s distribution of scores across the last 20 panels. Outliers (both top and bottom) are not bad interviewers; they are uncalibrated ones. The fix is a 30-minute rubric calibration, not a panel reshuffle.
Decision-stage dwell time. Hours from final panel to hiring-manager decision. A team operating at 24 hours wins candidates that would have ghosted a team operating at 5 days. The dwell time is set by how good the interview summary is.
Recruiter-input fit rate. Of the candidates each recruiter surfaced this quarter, what percentage advanced past the panel? The variance between top and bottom recruiters tells you where calibration sits.
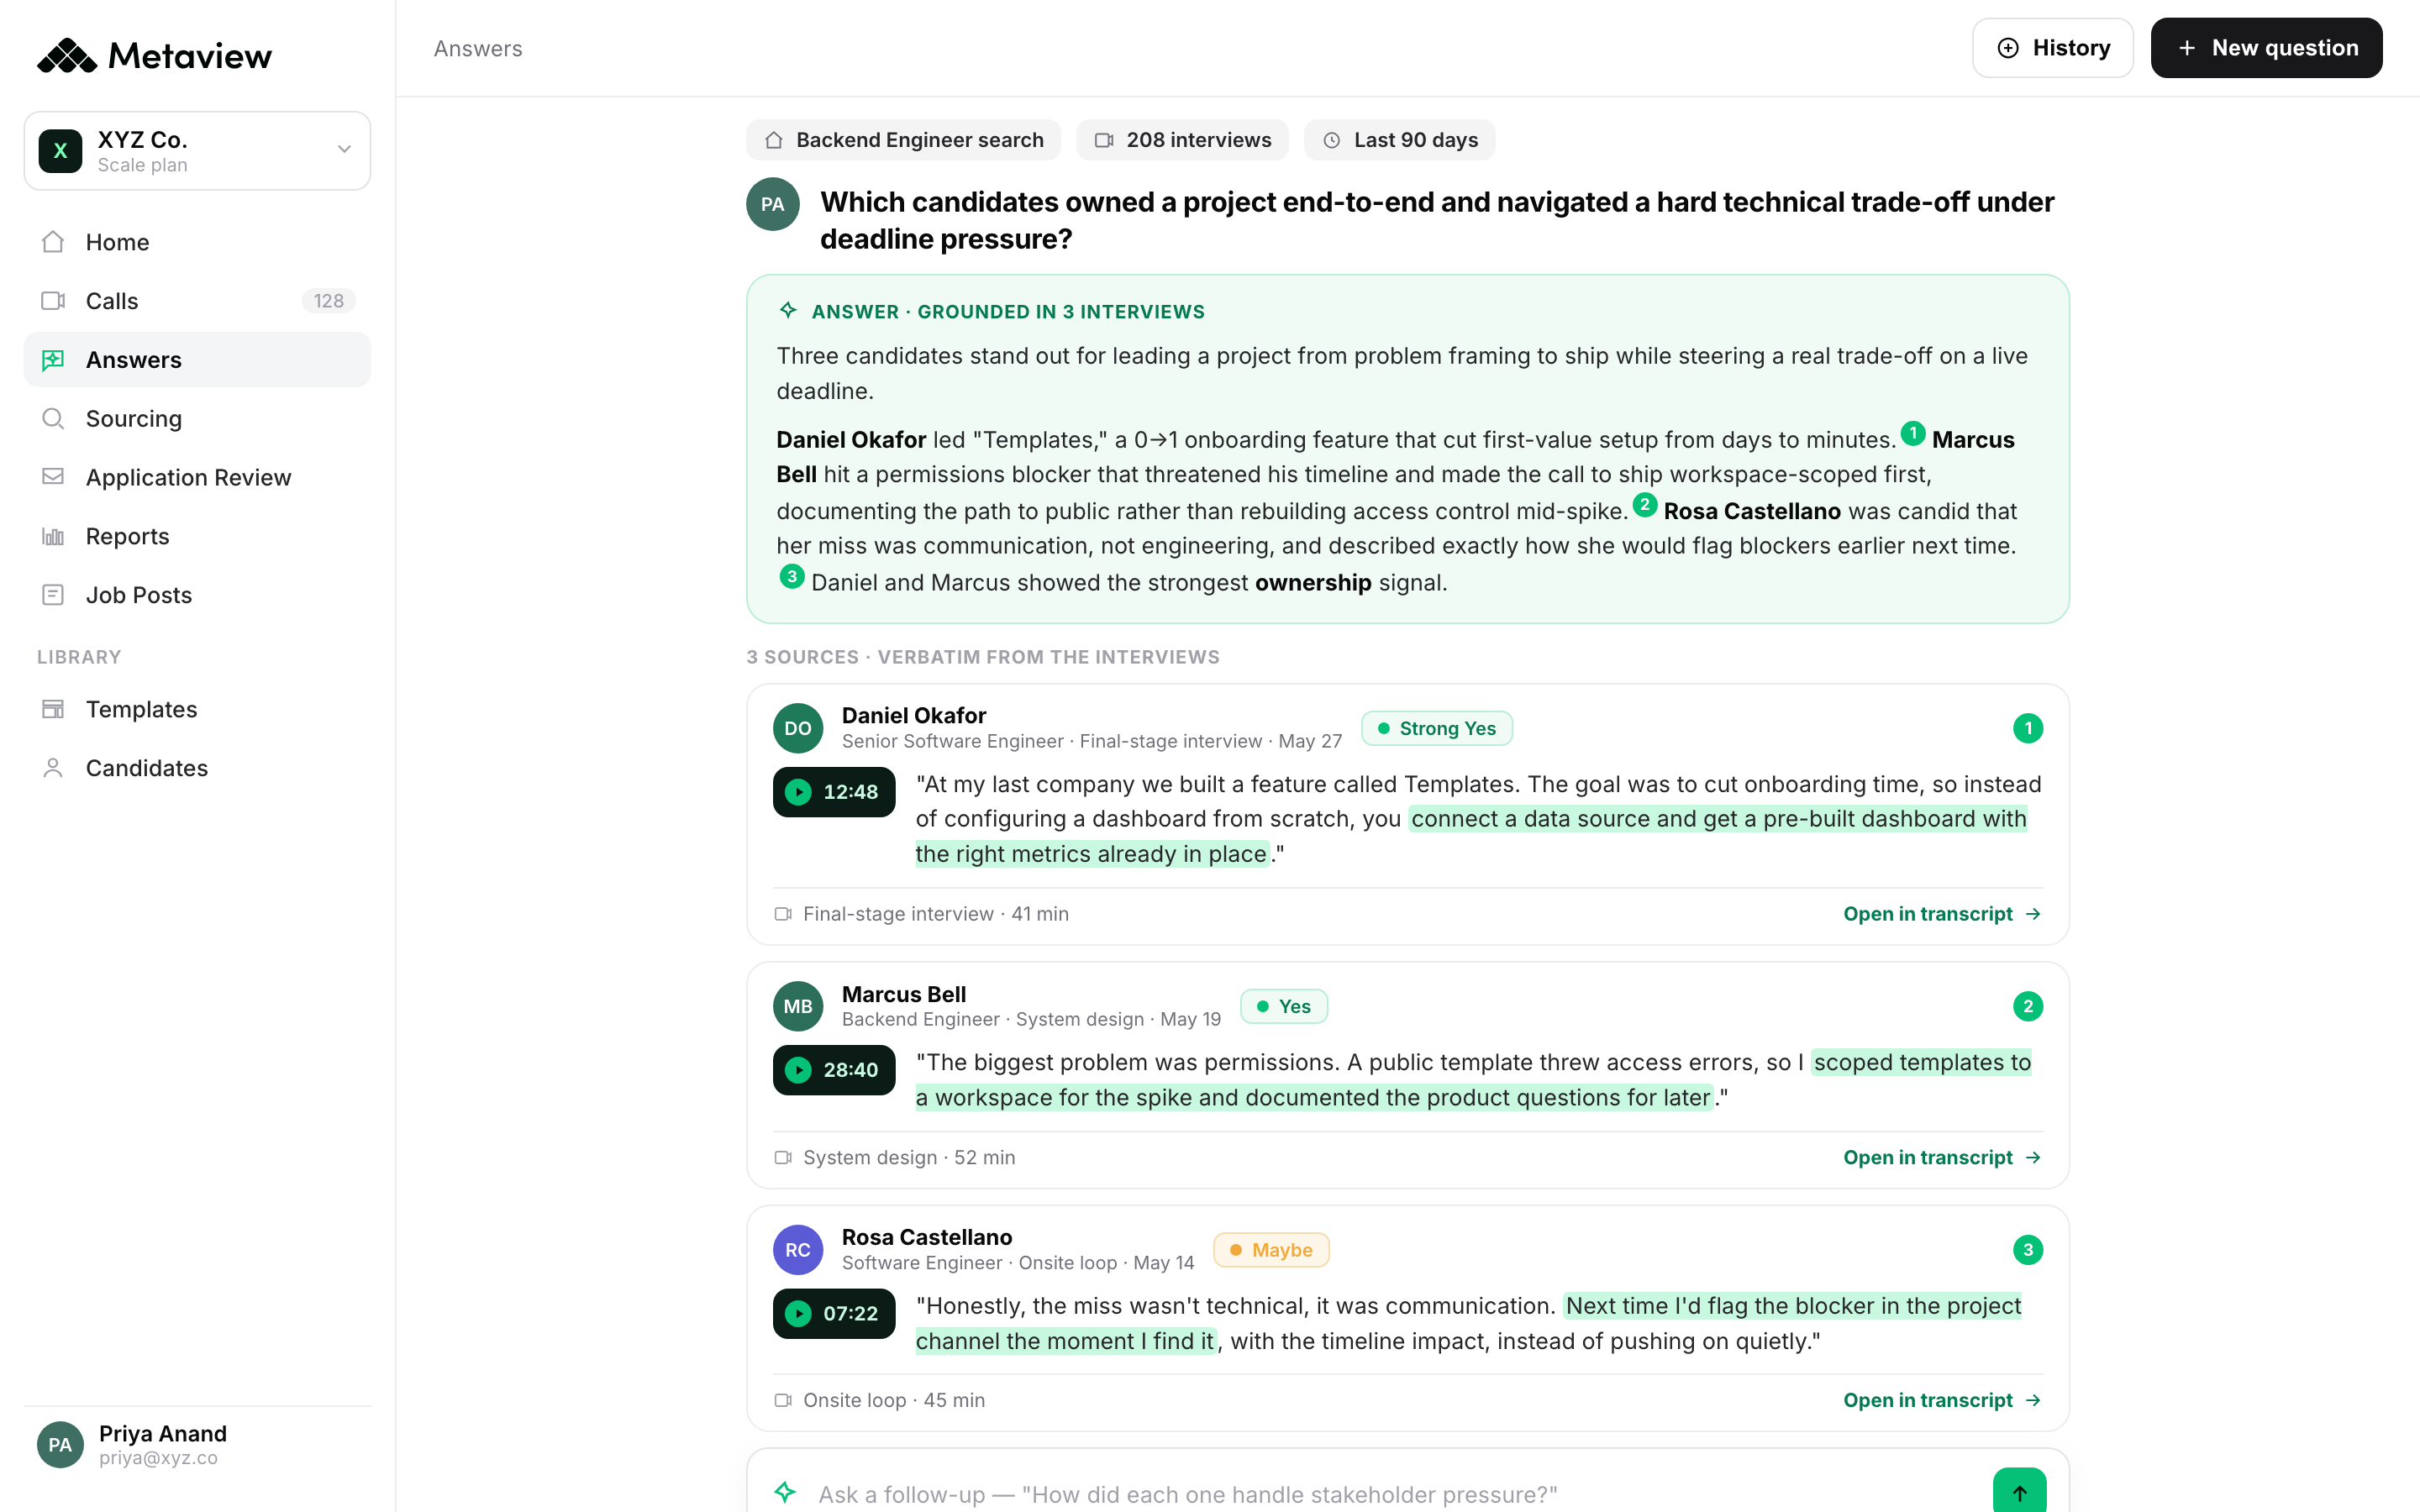
- 1Cross-panel summary surfaces consistent vs outlier interviewer judgements per competency. The calibration target is visible here, not in a quarterly review.
- 2Signal-quality scoring per competency. Reads at a glance which dimensions actually got assessed in the loop, and which got skipped under time pressure.
- 3Decision-stage handoff with hiring-manager recommendation and explicit risk flags. Cuts the dwell time between panel end and decision call.
Everyone is trying to go faster on time-to-hire. Great. You’re probably also fastest to attrition. Probably not great.”
A 7-day signal-layer reset
You do not need a new system or a new ATS to start moving the metric. You need a week of focused capture, one calibration session, and one change to the recruiter scorecard. Run this as written. By Day 7 you will have a working baseline for every leading indicator above, plus a clear read on which interviewer needs the first calibration conversation.
Repeat the calibration step every 4 to 6 weeks. The compounding kicks in around month three: interviewer drift drops, decision dwell collapses, and the recruiter scorecard starts reflecting quality rather than throughput. Net hire ratio follows the lagging timeline; the leading indicators move first.
Bring Metaview into your hiring stack.
Live notes, structured scorecards, and ATS sync - set up in under 10 minutes.
Frequently asked questions
What is a good net hire ratio?
There is no universal benchmark. A good net hire ratio depends on stage, growth target, and industry. High-growth companies may target strong positive ratios; mature organizations may aim for flat or slightly positive while focusing on quality and retention. The trend matters more than the absolute number. A team moving from 1% to 4% over four quarters is in better shape than a team at 6% that just printed three quarters of decline.
How is net hire ratio different from headcount growth rate?
They are close cousins, not the same metric. Net hire ratio counts only the hire and departure events; headcount growth rate also captures reorganizations, structural changes, and acquisitions. For a team purely tracking the effectiveness of its recruiting motion, net hire ratio is the cleaner signal because it filters out the non-recruiting changes.
Can net hire ratio be negative?
Yes. A negative net hire ratio means more employees left than joined during the period, so the workforce shrank. It is not automatically bad: a deliberate reduction in force, a strategic exit from a business line, or a maturity-stage reset can all produce intentional negative ratios. What matters is whether the negative ratio matches the intent of the operating plan.
Should contractors be included in net hire ratio?
It depends on whether the organization treats contractors as part of standard workforce reporting. The honest answer is to be consistent: pick one definition, document it, and apply it across periods. Including contractors makes the ratio more volatile because contract turnover is structurally higher than employee turnover. Excluding them makes the metric cleaner but understates total hiring capacity.
How often should you calculate net hire ratio?
Quarterly is the most common cadence and pairs well with most business reviews. Monthly tracking is useful for high-volume hiring orgs, especially during expansion periods, but the noise-to-signal ratio is higher month-over-month. Annual is too lagged to be useful as a steering metric. Whatever the cadence, hold it constant so trend lines stay readable.
Why does interview signal quality affect net hire ratio?
Because the formula directly subtracts departures from hires, and most regrettable departures inside the first 90 to 180 days were foreshadowed during the interview loop. Strong interview signal (consistent rubric coverage, calibrated scoring, structured decision summaries) predicts retention; weak signal predicts churn. Lifting the metric durably requires lifting signal quality, not just funnel speed.